Three days. The wettest August day Delhi had seen in two years. 5,261 registered visitors and 363 conference delegates who came anyway — and what they reveal about where India's water and wastewater market is actually moving.

Three days that moved India’s water market.
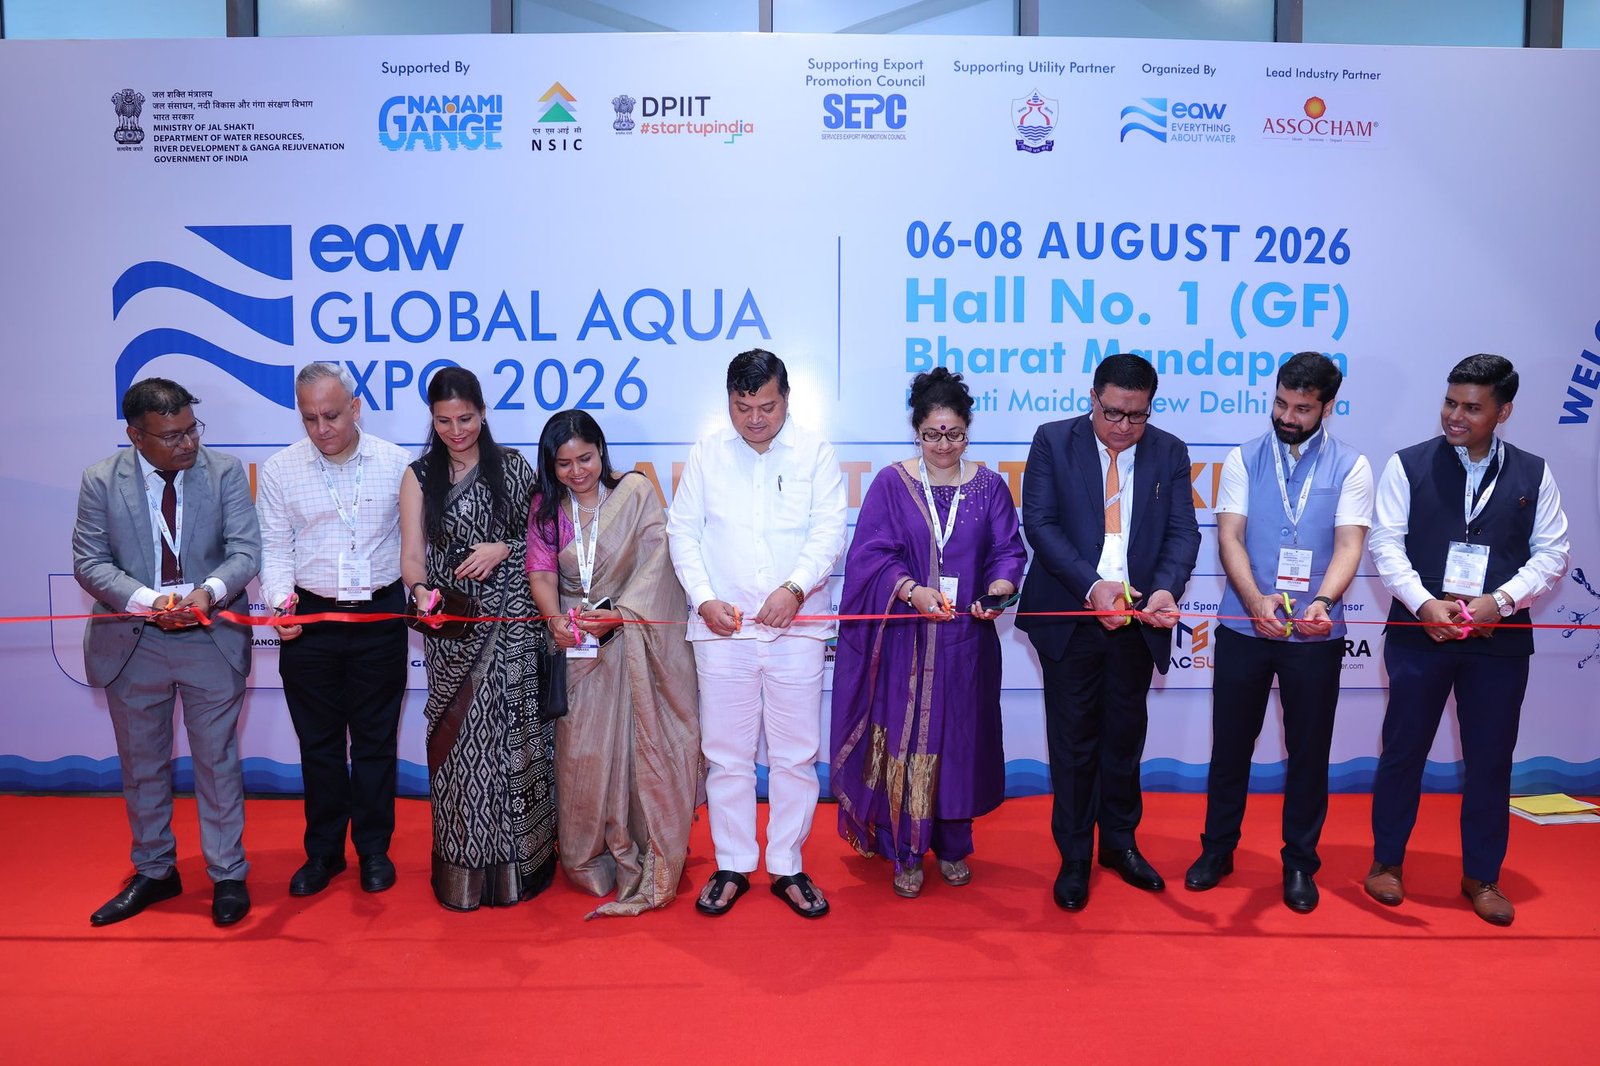
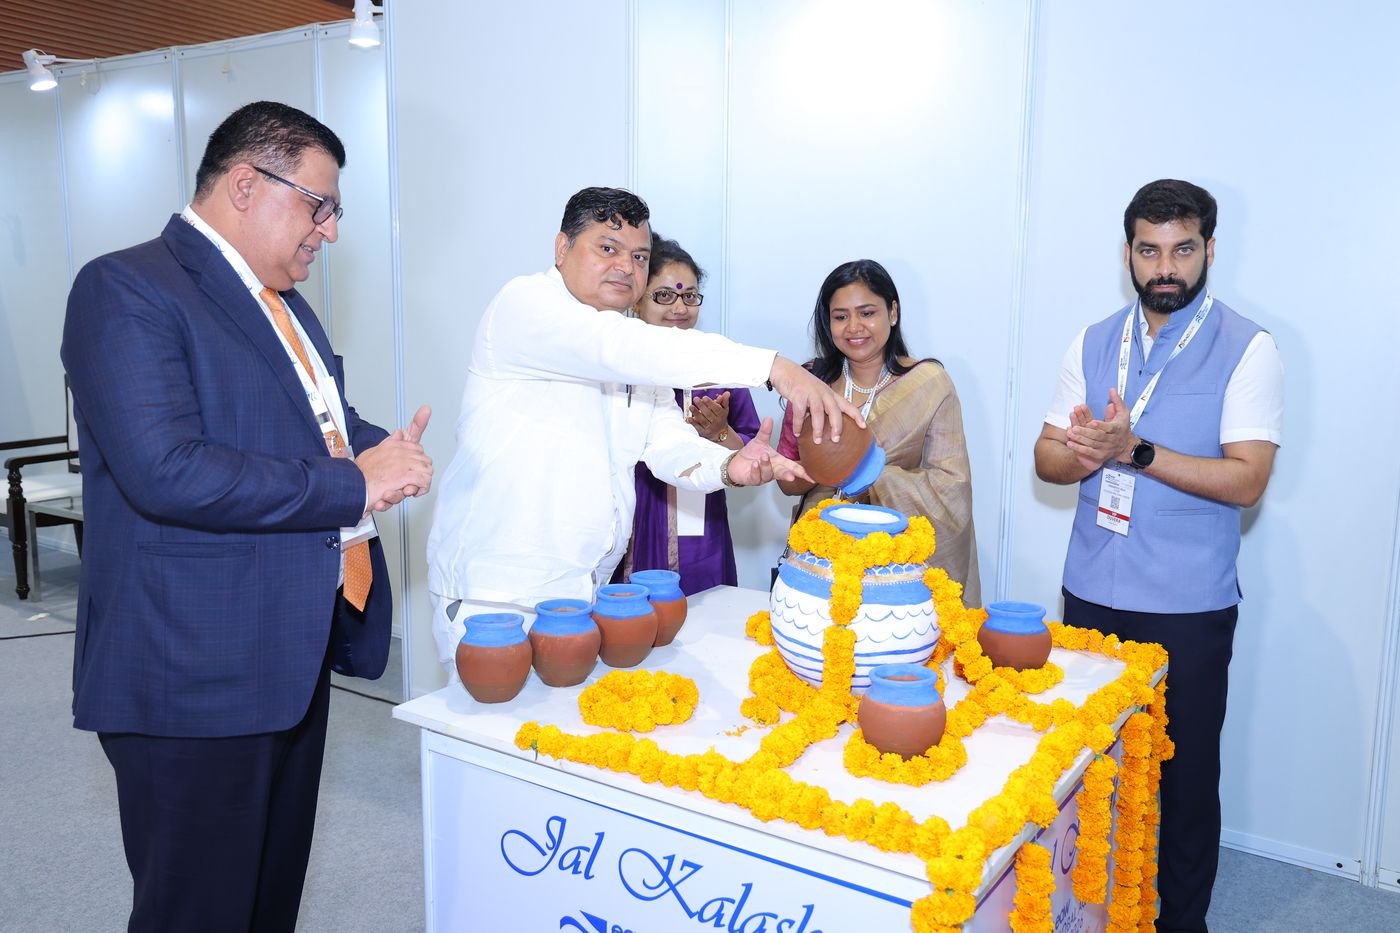
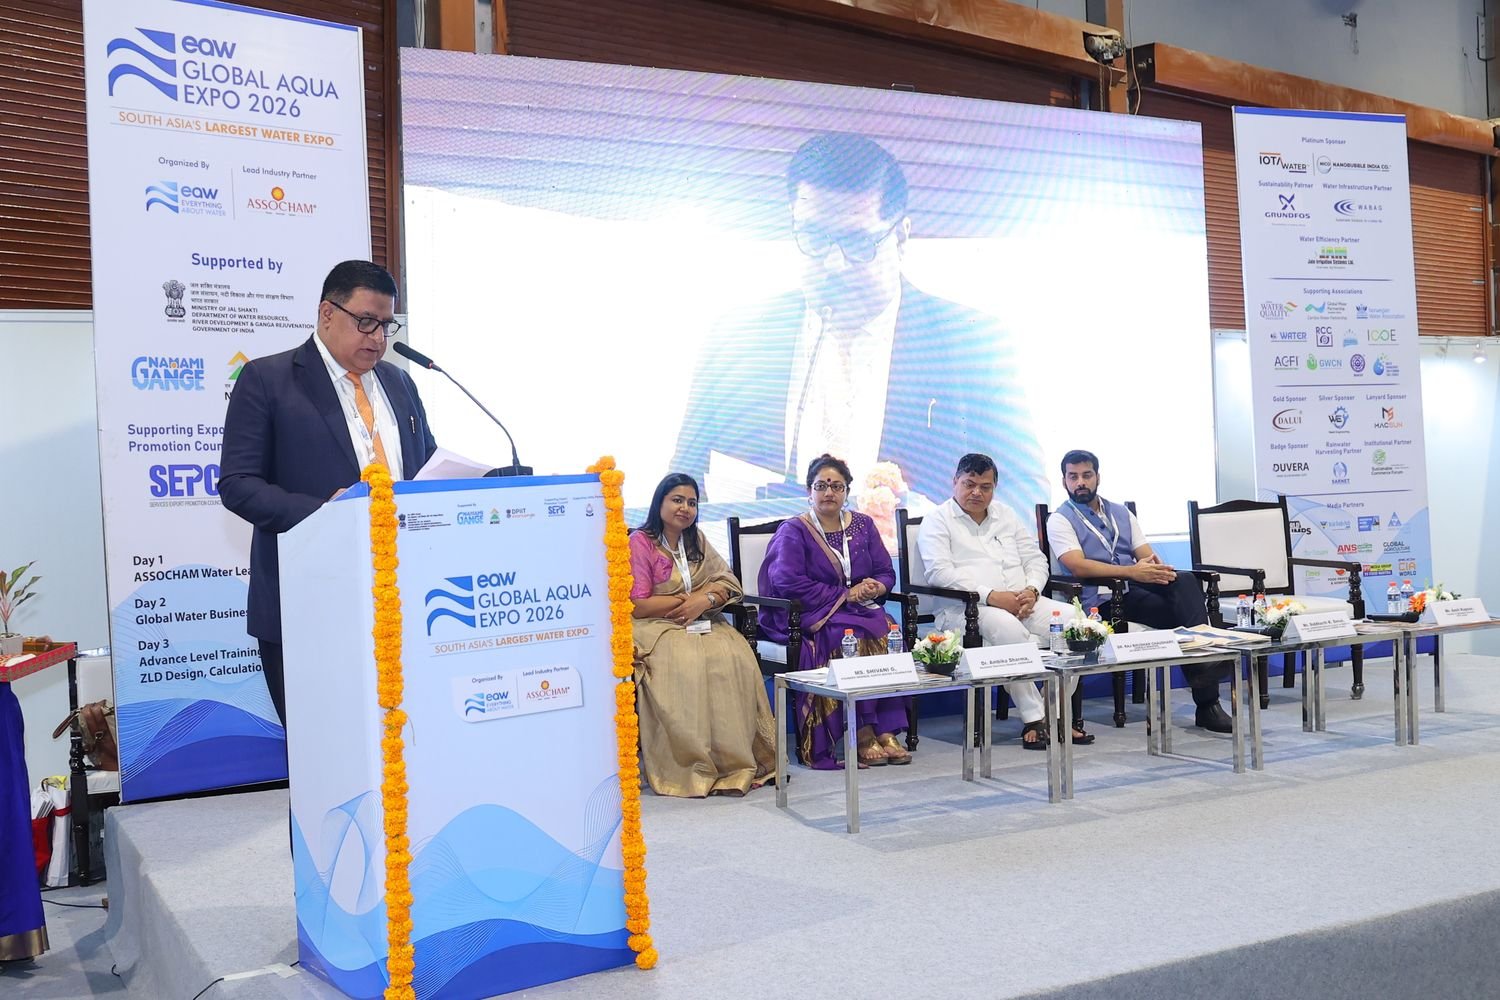
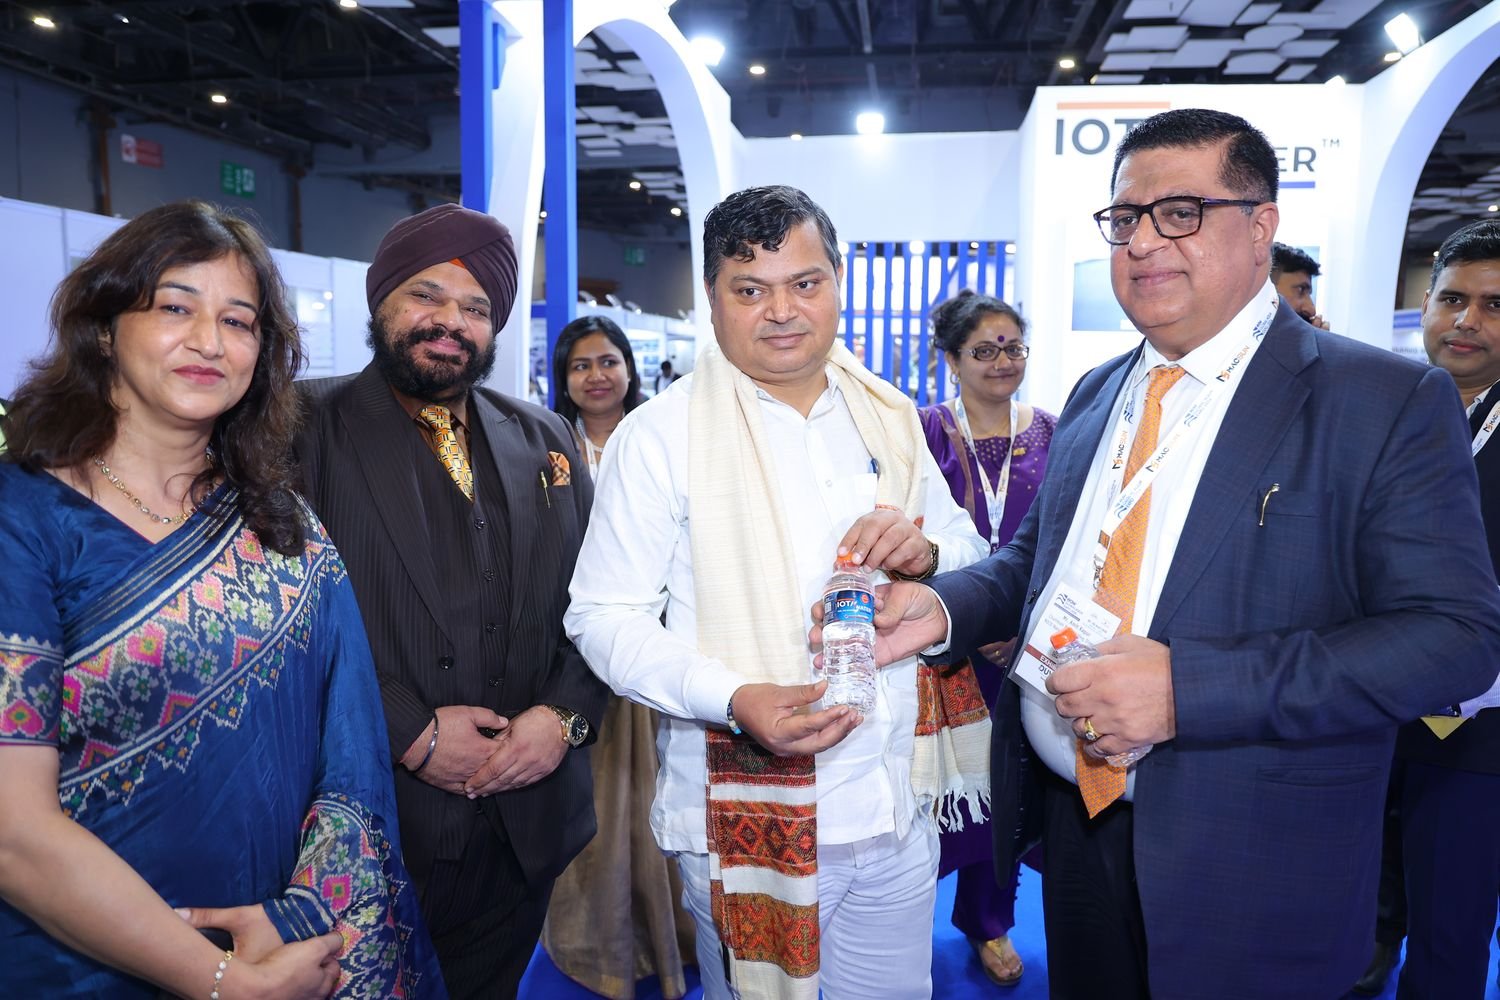
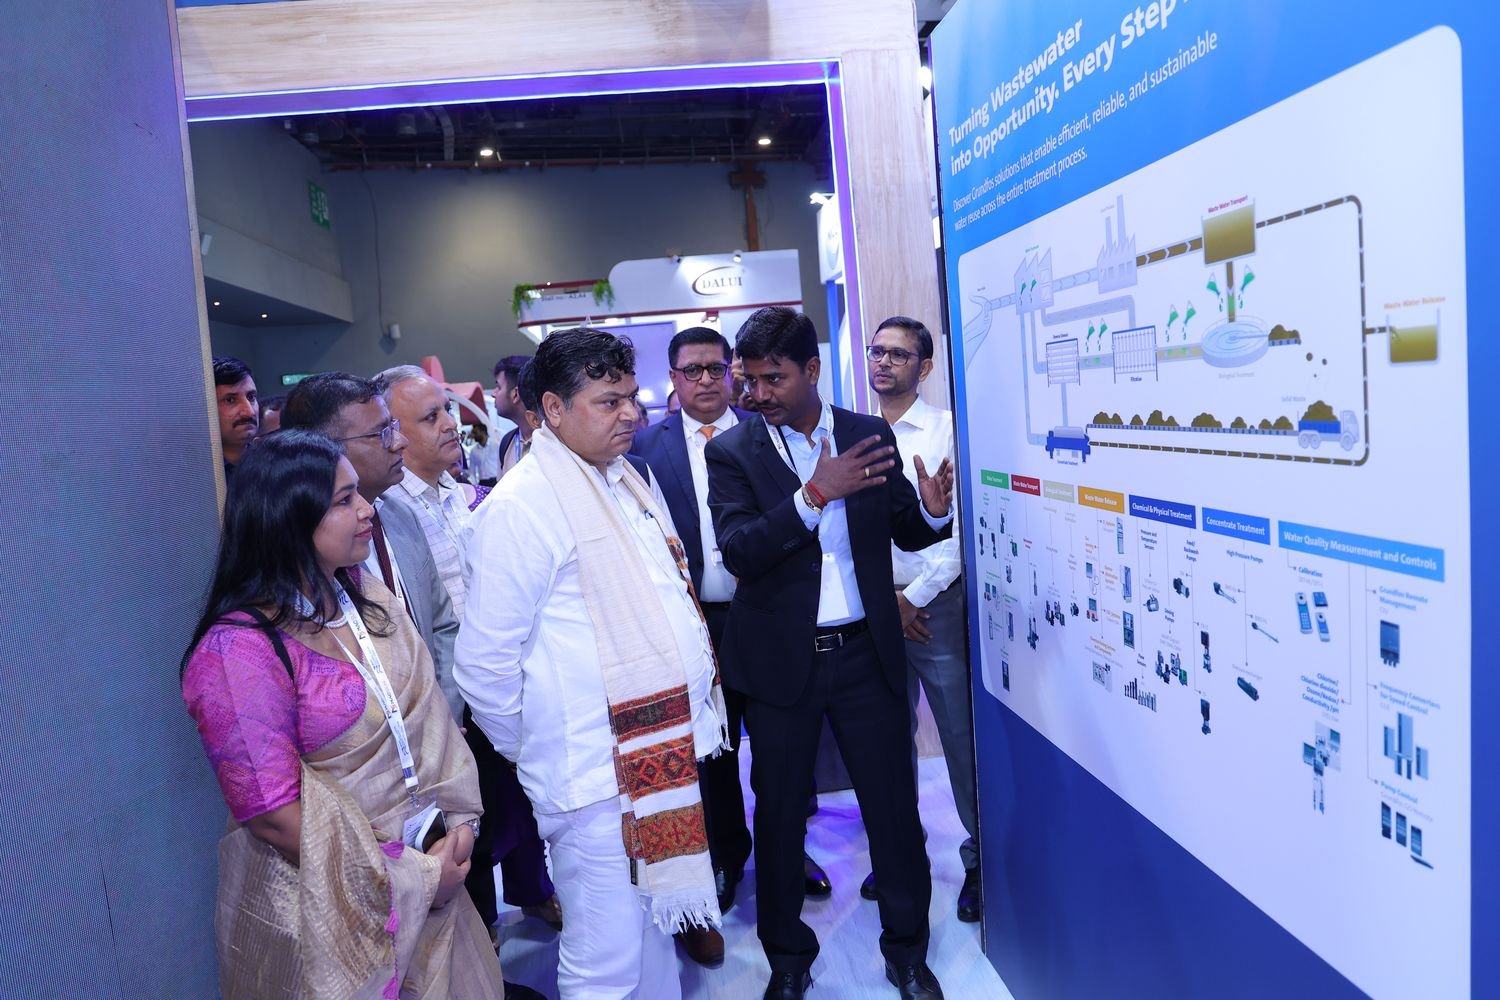
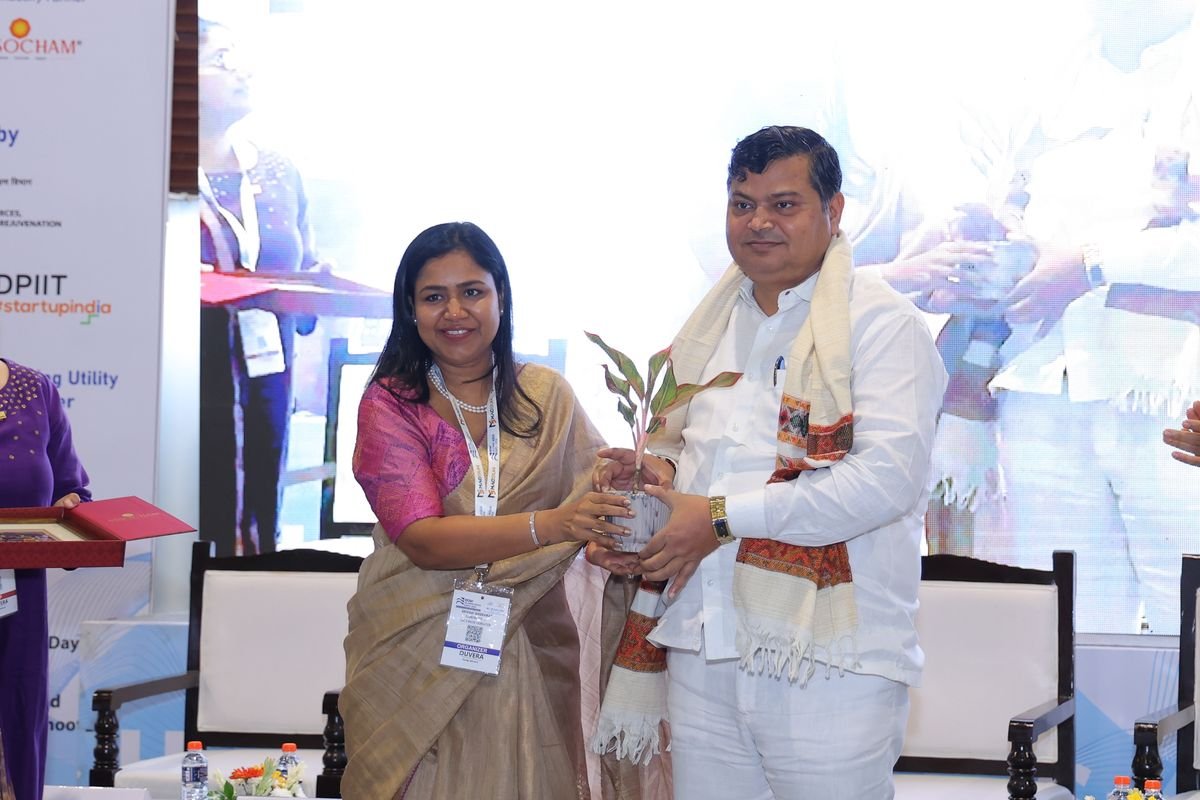
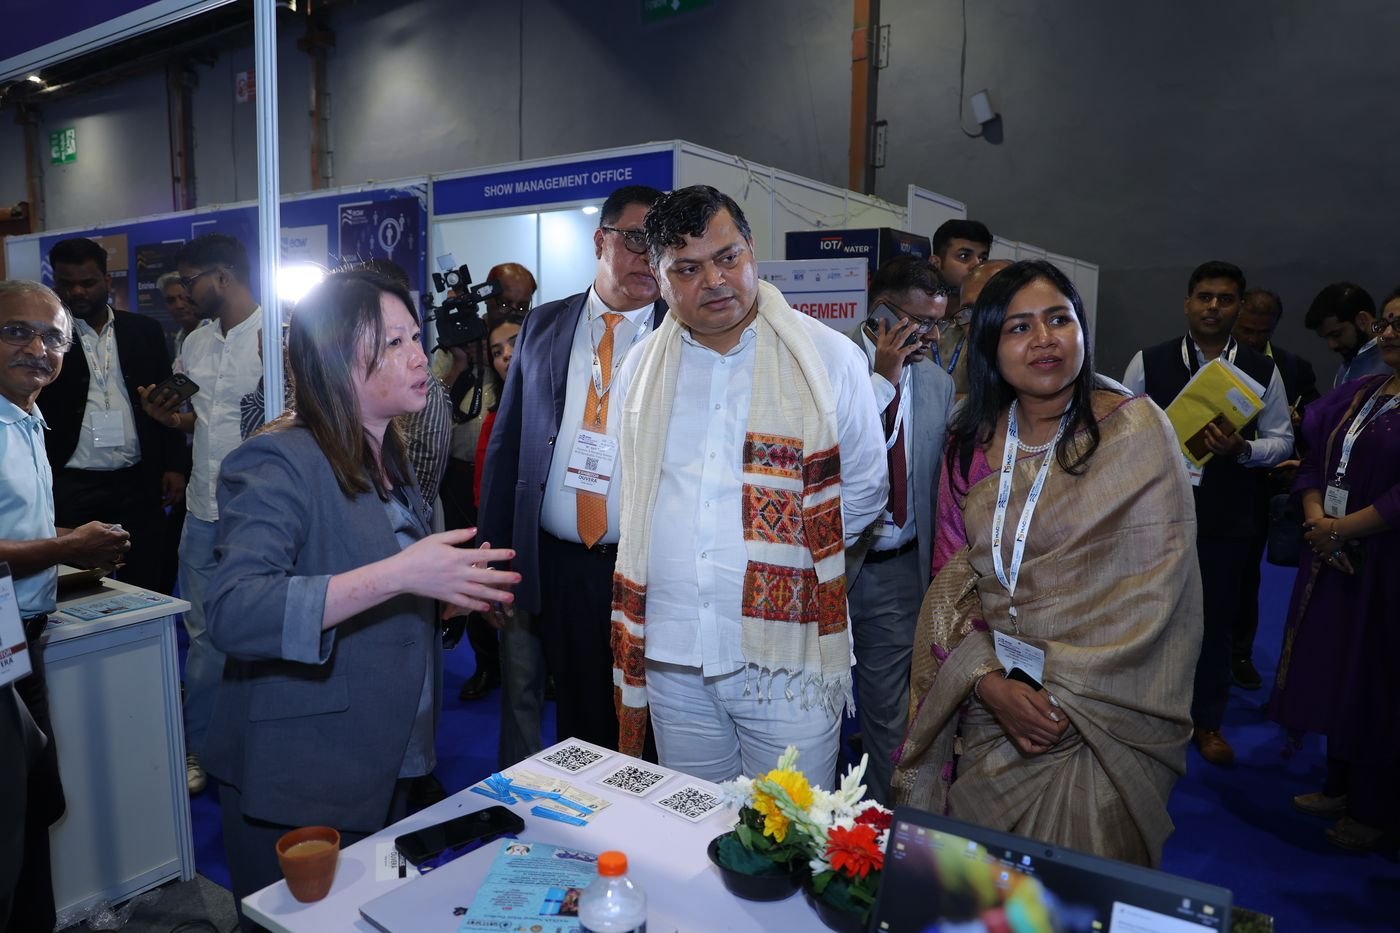
The inauguration of the 21st edition, Hall No. 1, Bharat Mandapam.
EAW Global Aqua Expo 2026 ran for three days at Bharat Mandapam, New Delhi. These are the confirmed figures for the 21st edition.
This is a post-show intelligence report, not a summary. Every figure is traceable to a named source file. Where a number could not be verified from the data supplied, it is marked and left open rather than estimated.

Twenty-one editions ago we began with one conviction: that India's water problems and India's water solutions existed in the same country but almost never in the same room. Everything About Water started in 2004 to close that gap. This Expo is the physical form of the same idea.
The conviction has not changed. What has changed is who now walks into the room. Over three days in August, a Union Minister, a former Chief Secretary, a state Water Resources Department, the capital's water utility, an export promotion council of the Ministry of Commerce and Industry, global manufacturers and seventeen micro and small enterprises stood on the same floor, on the same terms. That is not a courtesy. It is the entire mechanism by which a good technology becomes an installed asset.
I want to say something about the numbers in the pages that follow, because how a report is written tells you what an organisation believes.
We have published what we can prove. 5,261 registered visitors, each with a unique badge record. 159 exhibiting companies. 242 business meetings held in the Global Water Business Lounge. 38 launches and presentations on the Innovation Spotlight Arena. 52 recorded conversations with leaders. 55 speakers. More than 50 delegates certified from the training programme. Where a figure could not be verified from a record, we have said so plainly rather than round it upward. An exhibitor deciding whether to return deserves that, and so does a ministry deciding whether to lend its name.
I also want to name what this edition did not do. Almost seven in ten of our visitors came from Delhi and the National Capital Region. That is a strength for a Delhi show and a limit for a national platform. Much of India's industrial water demand sits in the South and the West, and this year we did not reach enough of it. That single fact is why, from 2027, the platform runs in two cities rather than one.
My thanks to every exhibitor who took a stand, every speaker who prepared properly, every ministry and institution that lent its credibility, and every visitor who took three days away from a plant, an office or a site to be in that hall. The most useful conversations at this event have always happened between the sessions. I hope you had one.
Ms. Shivani Ghorawat
Founder Member, Earth Water Foundation and Everything About Water

Three days after a show closes, the honest question is not how many people walked in. It is whether the right people met each other, and whether anything will happen because they did.
This report is written to answer that question with data rather than adjectives. Some of what it shows is encouraging. Some of it is a to-do list for us.
The encouraging part first. 5,261 professionals registered across the three days, from roughly 3,990 distinct organisations. Nearly four in ten carried an owner, director, CXO or senior management title. In the Global Water Business Lounge we ran 242 scheduled meetings, an average of 81 a day. The Innovation Spotlight Arena delivered 38 launches and presentations, above what we planned. We recorded 52 leadership interviews. More than 50 paid delegates completed the full-day ETP, STP and ZLD masterclass on the Saturday and left with a certificate.
One number I would ask exhibitors to look at closely. 1,116 visitors told us at registration that they were here to source technology, meet suppliers, find partners or do business. That is 8.1 declared commercial visitors for every stand on the floor. Whether that turned into an order depends on what happened at your stand, not on the gate. But the traffic was there.
The part that is a to-do list: 85.6% of Indian visitors came from the northern states, and 61.6% came from Delhi NCR alone. That is a strength for a Delhi edition and a limitation for a national platform. It is also exactly why the 2027 calendar splits into two cities. Hyderabad in February goes to where the plants are. Delhi in August stays where the policy is.
Two more things we learned. Government, municipal and utility participation grew significantly once the doors opened — 190 of the 324 public-sector registrations came in during the show itself, not before. That is a registration-process problem, not a demand problem, and it is fixable. And a third of visitors skipped the industry-segment question entirely at registration, which cost us intelligence we would have used to match buyers to stands. We are redesigning that form.
What has not changed in 21 editions is the reason the platform exists. India does not have a shortage of water technology. It has a shortage of the meetings that put technology into a project. Everything in this report should be read against that single test.
Mohammad Wasim Fazal
Business Head, EAW Global Aqua Expo · Earth Water Foundation
The 21st edition of India's longest-running water and wastewater exhibition drew a demonstrably senior, demonstrably commercial, and demonstrably North-Indian audience.

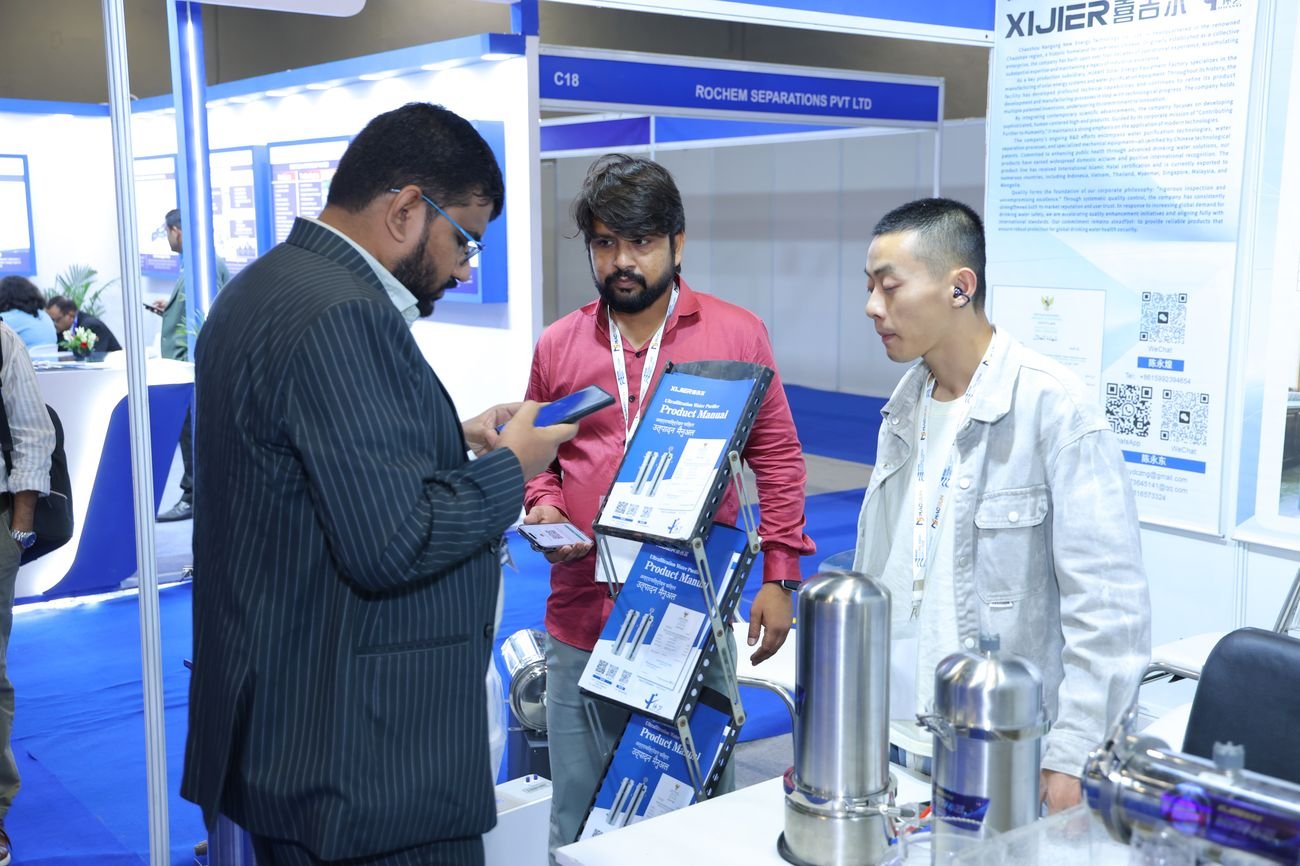
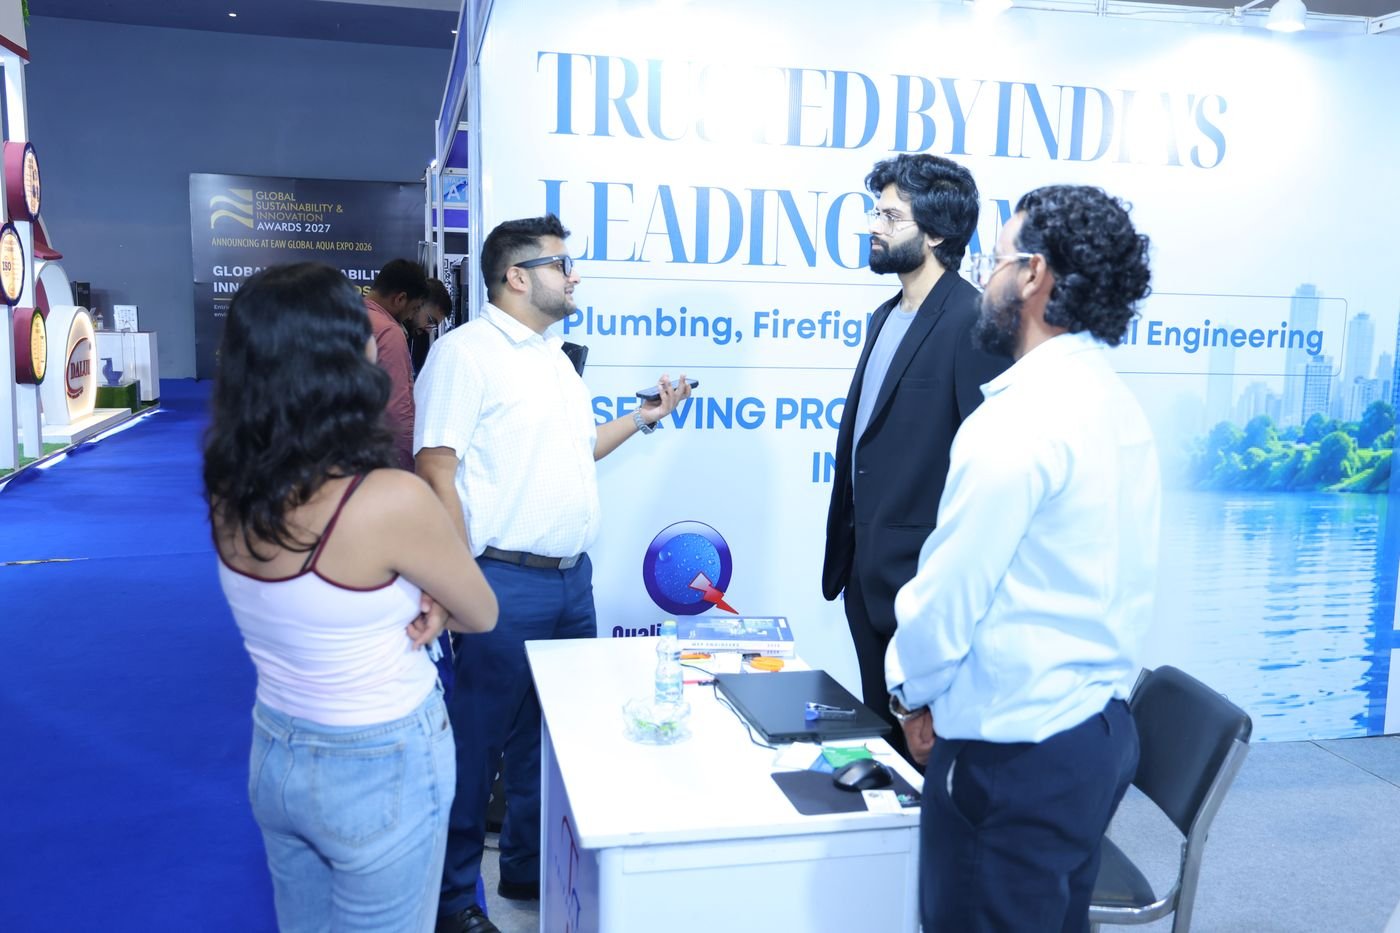
The event. EAW Global Aqua Expo 2026 ran from 6 to 8 August 2026 at Bharat Mandapam, Pragati Maidan, New Delhi, in Hall No. 1 on the ground floor, across a total footprint of 7,500 square metres of which 2,500 square metres was exhibition space. It was organised by Earth Water Foundation with ASSOCHAM as Lead Industry Partner, and supported by the Ministry of Jal Shakti, Namami Gange, NSIC, DPIIT Startup India, the Ministry of MSME, Delhi Jal Board as Supporting Utility Partner and the Services Export Promotion Council as Supporting Export Promotion Council. Five platforms ran in parallel across the three days: the exhibition floor, a three-day conference, a B2B business zone, a market-access and government facilitation hub, and a knowledge programme built around the Innovation Spotlight Arena and the EAW Water Academy.
The conditions. The Expo ran through the peak of the 2026 monsoon. In the eight days that contained the show, Delhi received effectively its entire average August rainfall. In the 24 hours ending at 08:30 on Saturday 8 August — the final show day — the Safdarjung base observatory recorded 98.7 mm, the heaviest August rainfall the capital had seen in two years. Lodhi Road, the observatory closest to Pragati Maidan, recorded 86.8 mm in the same period, and rain continued through Day Three trading hours. Against that, Day Two drew 573 new registrations and Day Three drew 538 — 88% of the Day One figure, on a Saturday, in the rain.
Who came. 5,261 unique visitor registrations were recorded, drawn from approximately 3,990 distinct organisations across 23 Indian states and union territories, 788 cities and 12 countries. 1,454 visitors (38.9% of the total, and 45.3% of those who gave a classifiable job title) held owner, founder, proprietor, partner, CXO, director or senior-management titles. The single largest self-declared segment was water and wastewater companies (756 registrations), followed by manufacturers and technology providers (698), consultants (284), startups (252), industrial end users (232) and distributors (232). Government departments, municipal corporations, water utilities and public-sector undertakings together accounted for 270 unique visitors carrying 324 segment selections. A further 363 conference delegates were badged separately through the delegate stream, taking combined registered participation to 3,893 before exhibitor staff, speakers, media and contractors are counted.
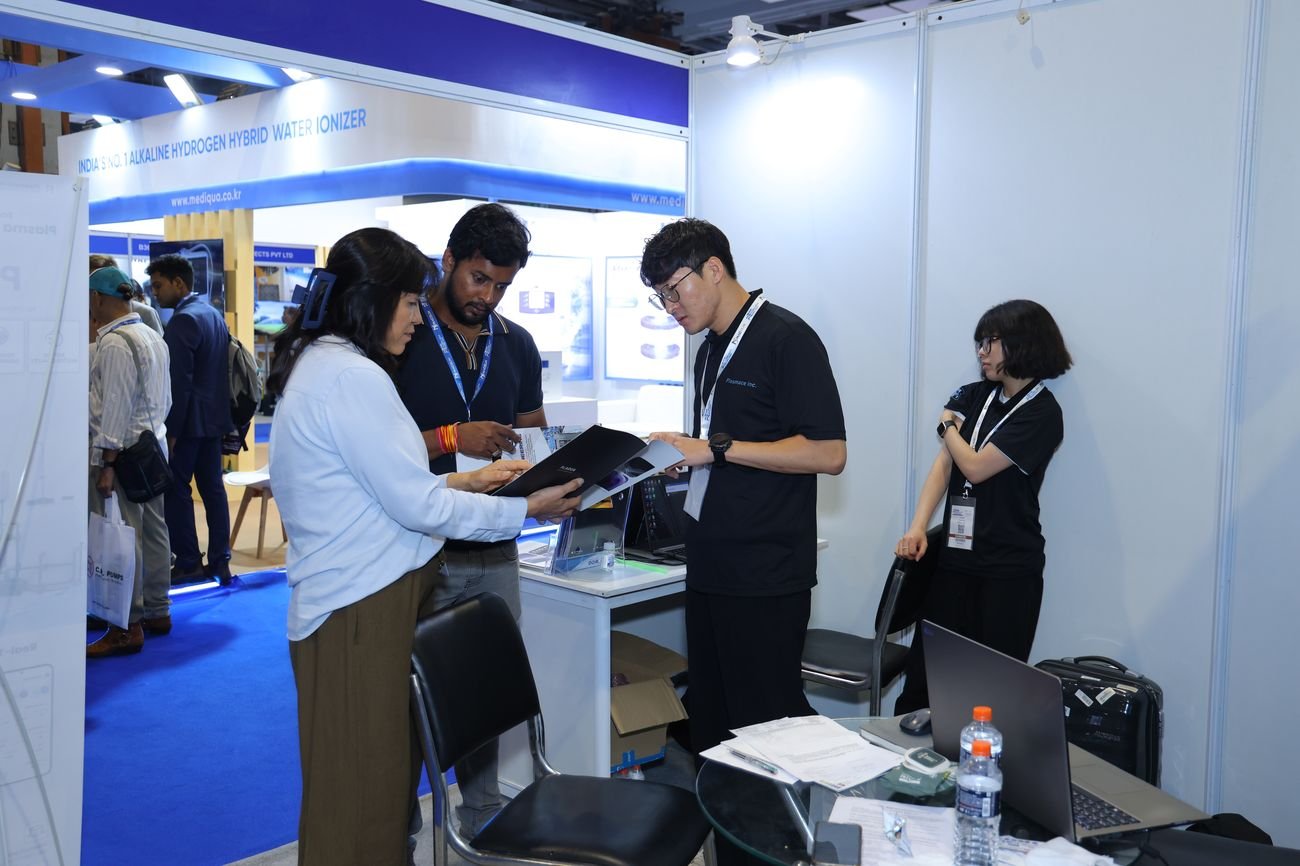
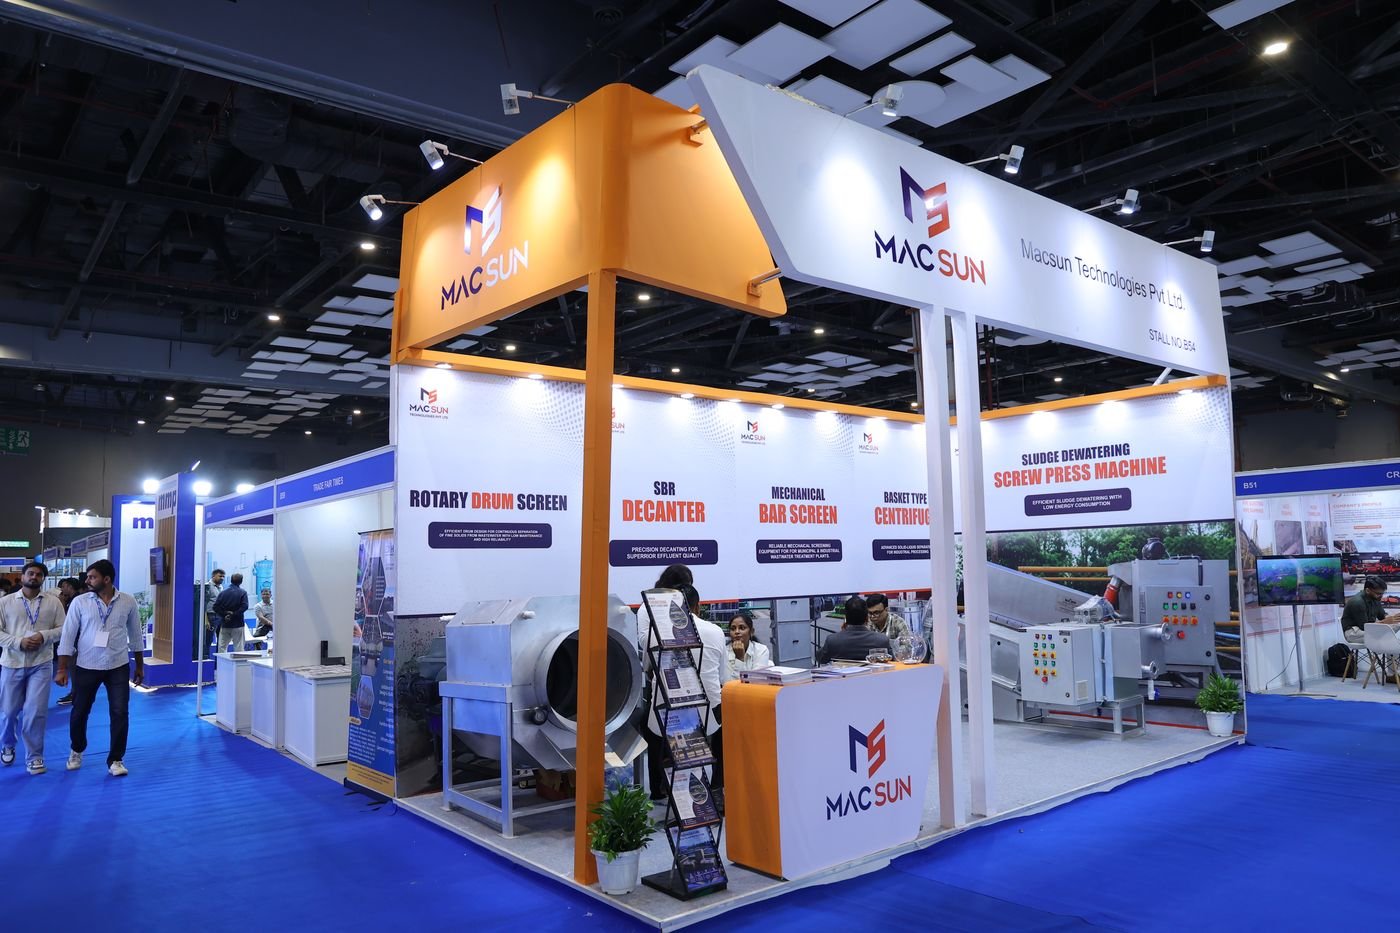
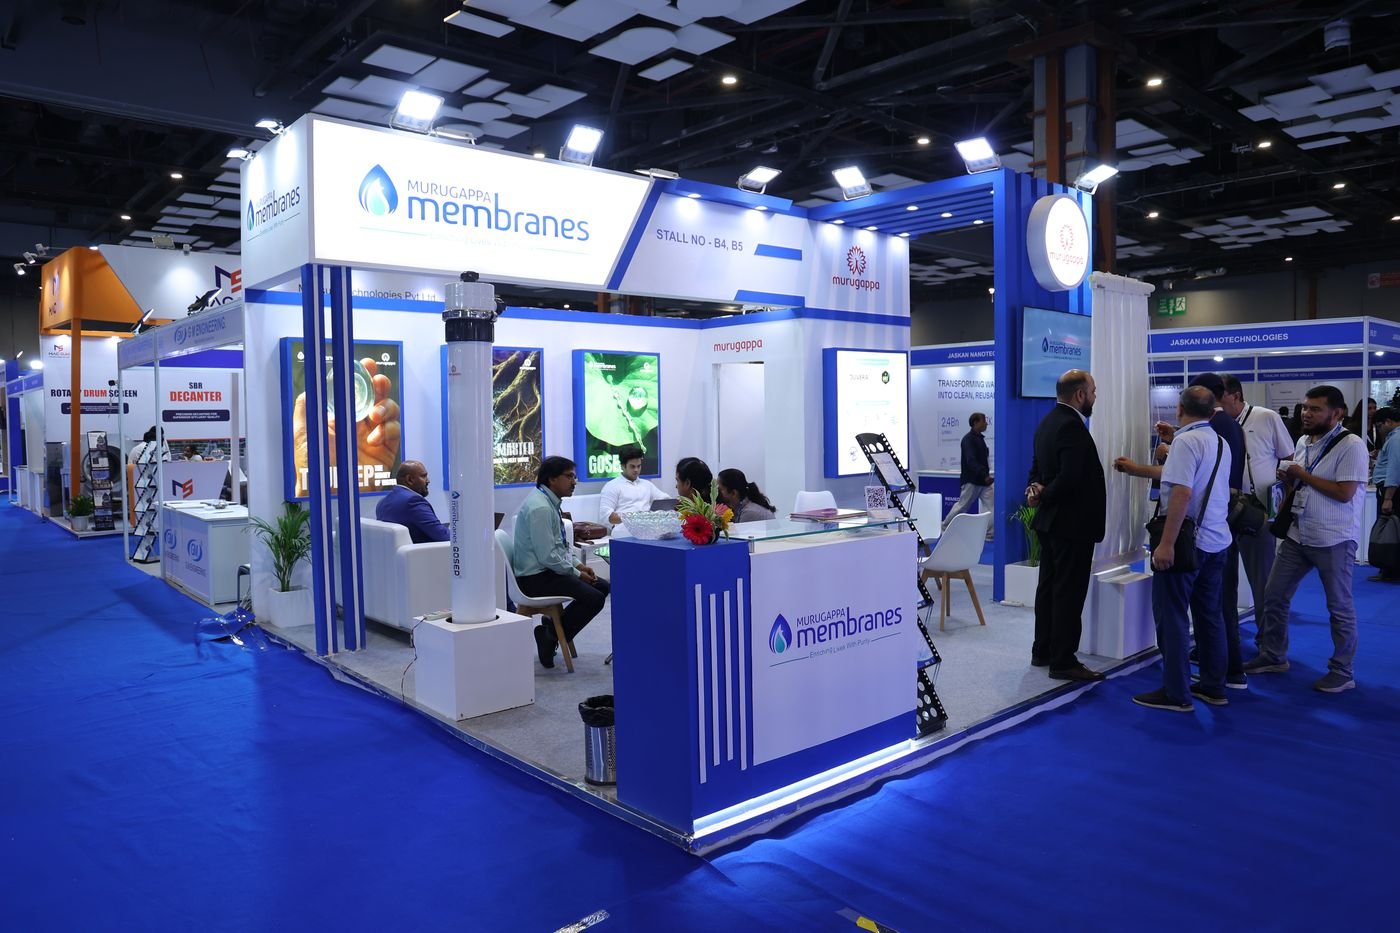
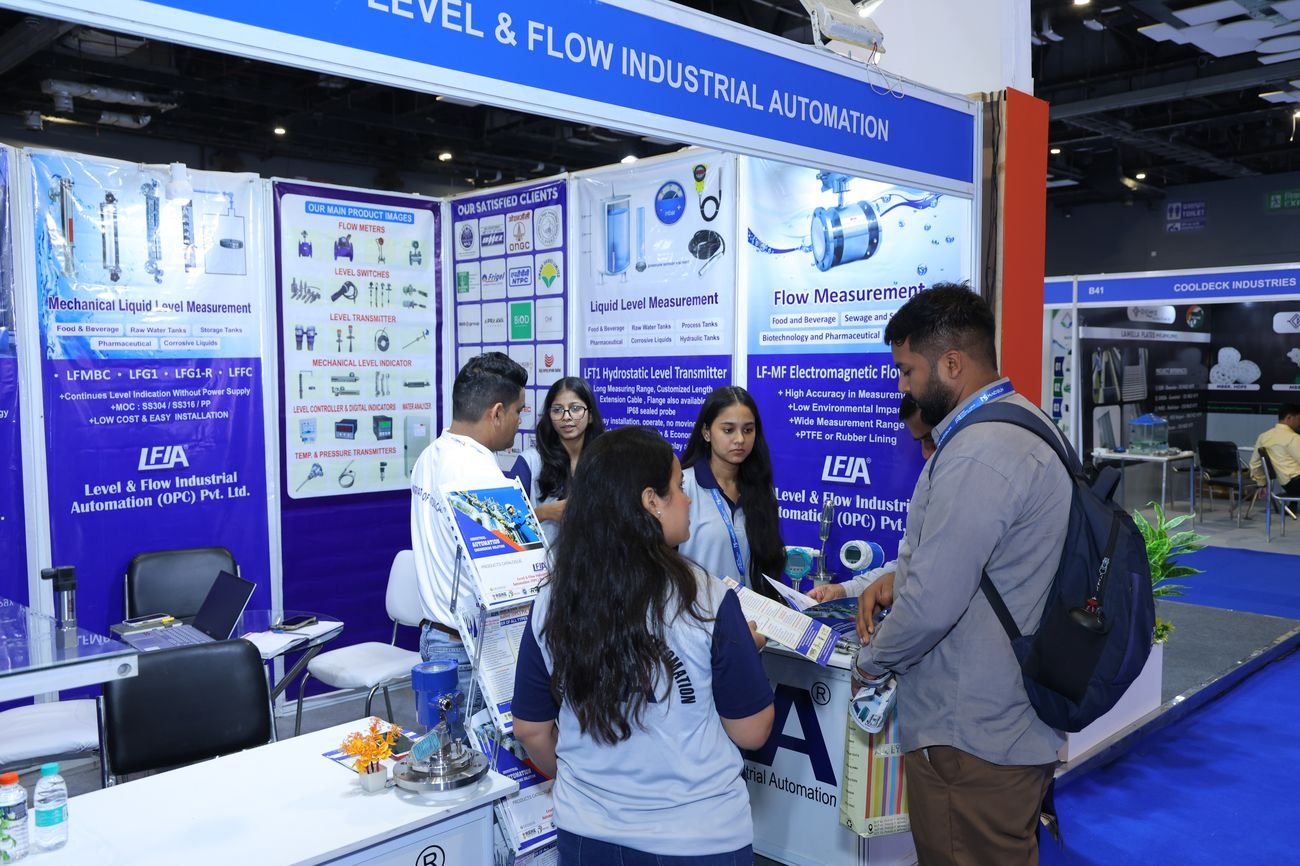
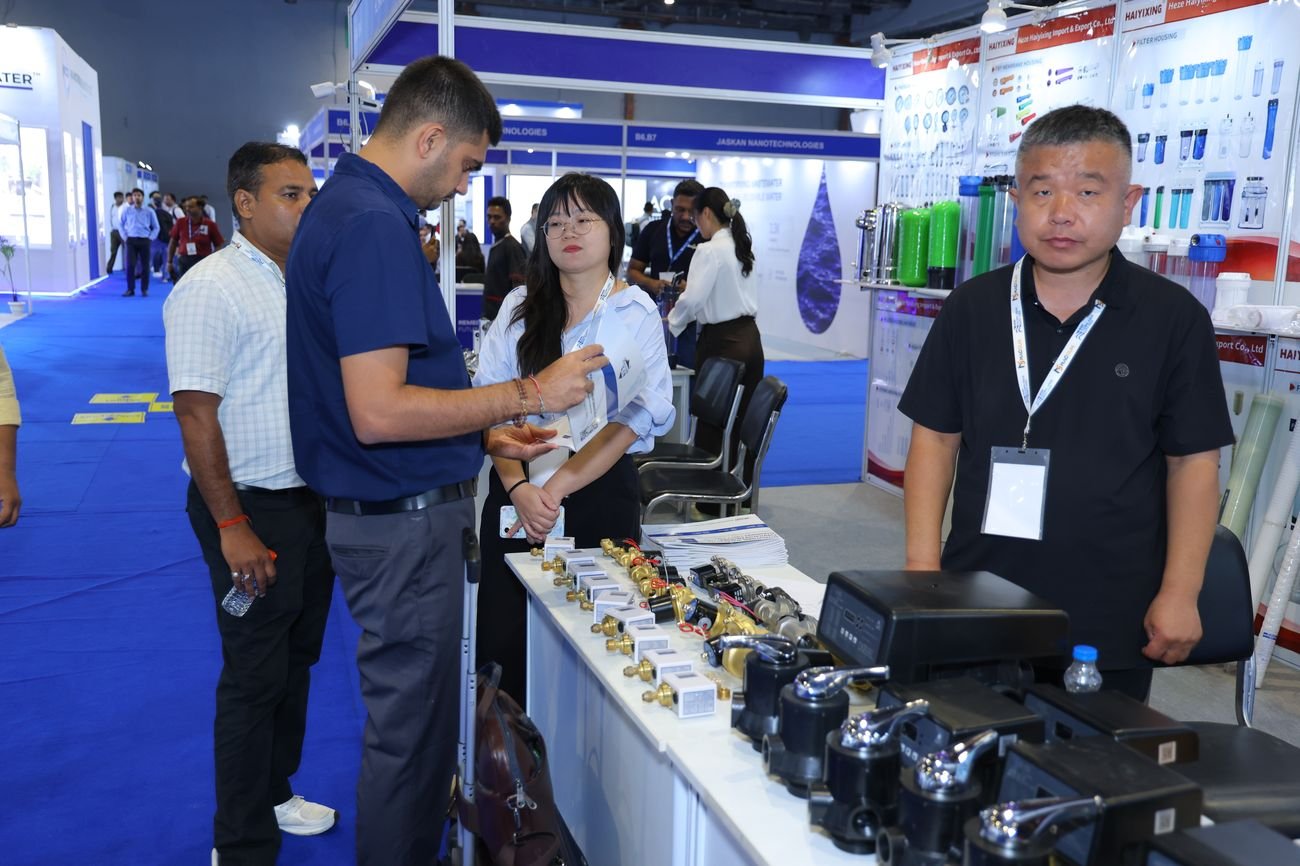
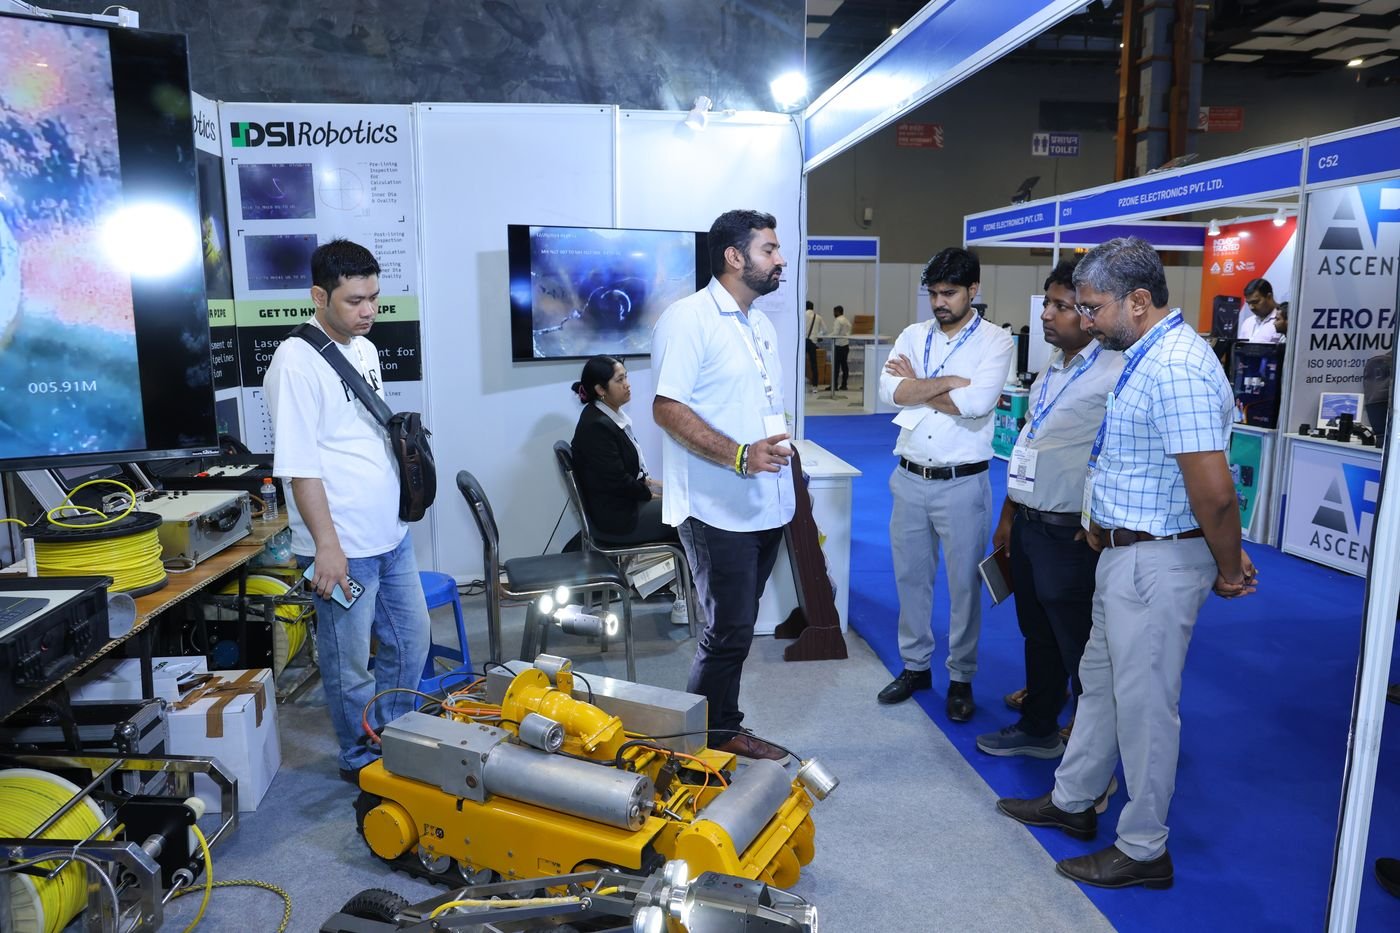
What was on the floor. The official Show Directory lists 164 organisations, of which 159 exhibited on the floor and 137 held allocated stands and 27 participated as partners, associations, government bodies or media without a dedicated stand. Company profiles were classified across 22 product and solution categories. Water and wastewater treatment plants was the largest category at 48 listings, followed by digital water, IoT, AI and automation (19), membranes, RO and filtration (17), and instrumentation, metering and sensors (17). Eighteen international companies from eight countries exhibited, and seventeen enterprises took stands under the Ministry of MSME's Procurement and Marketing Support Scheme.
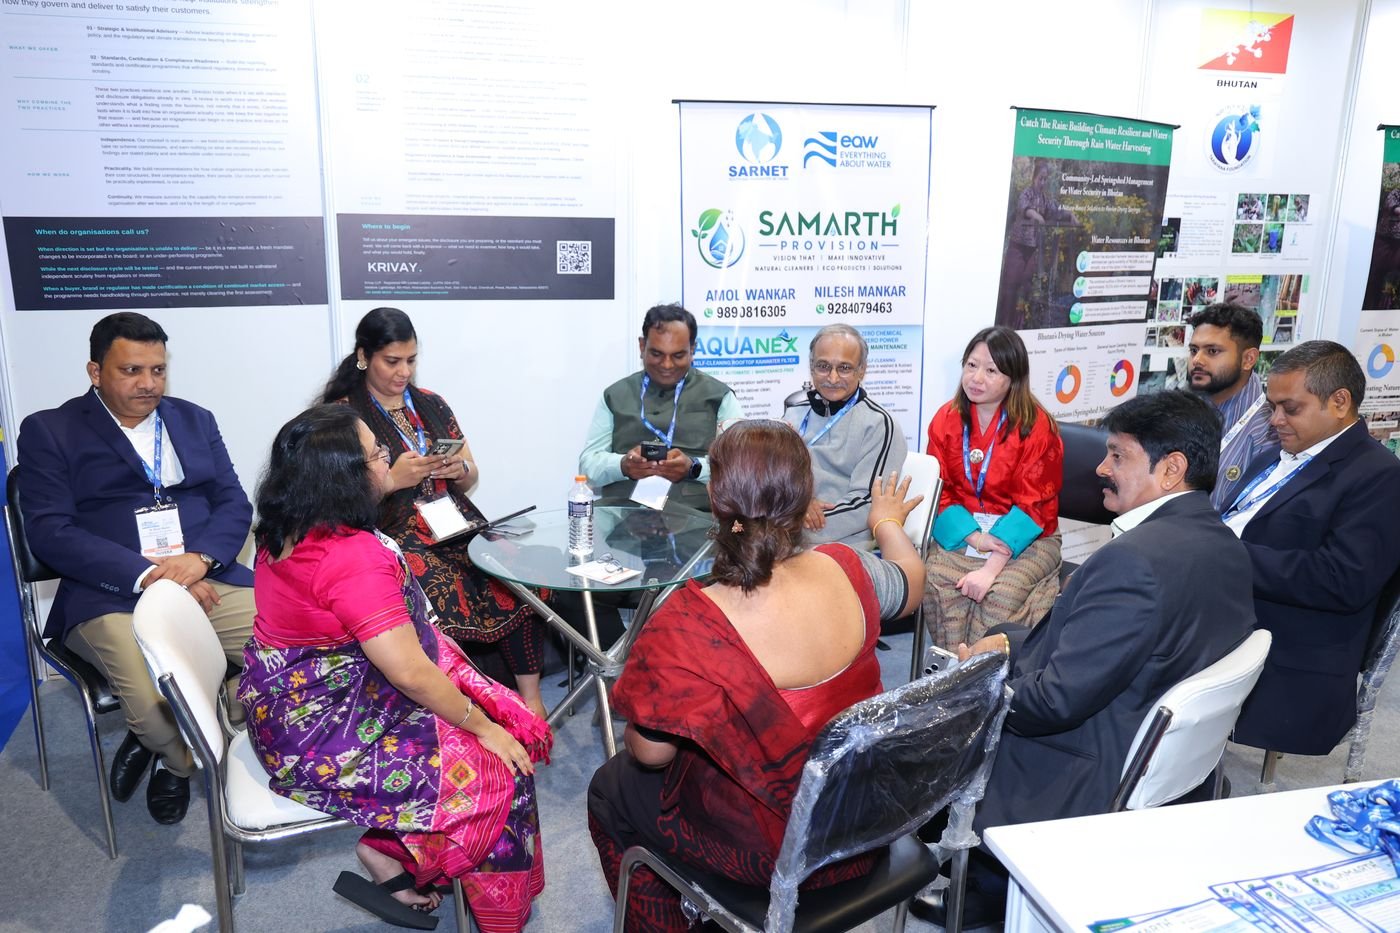
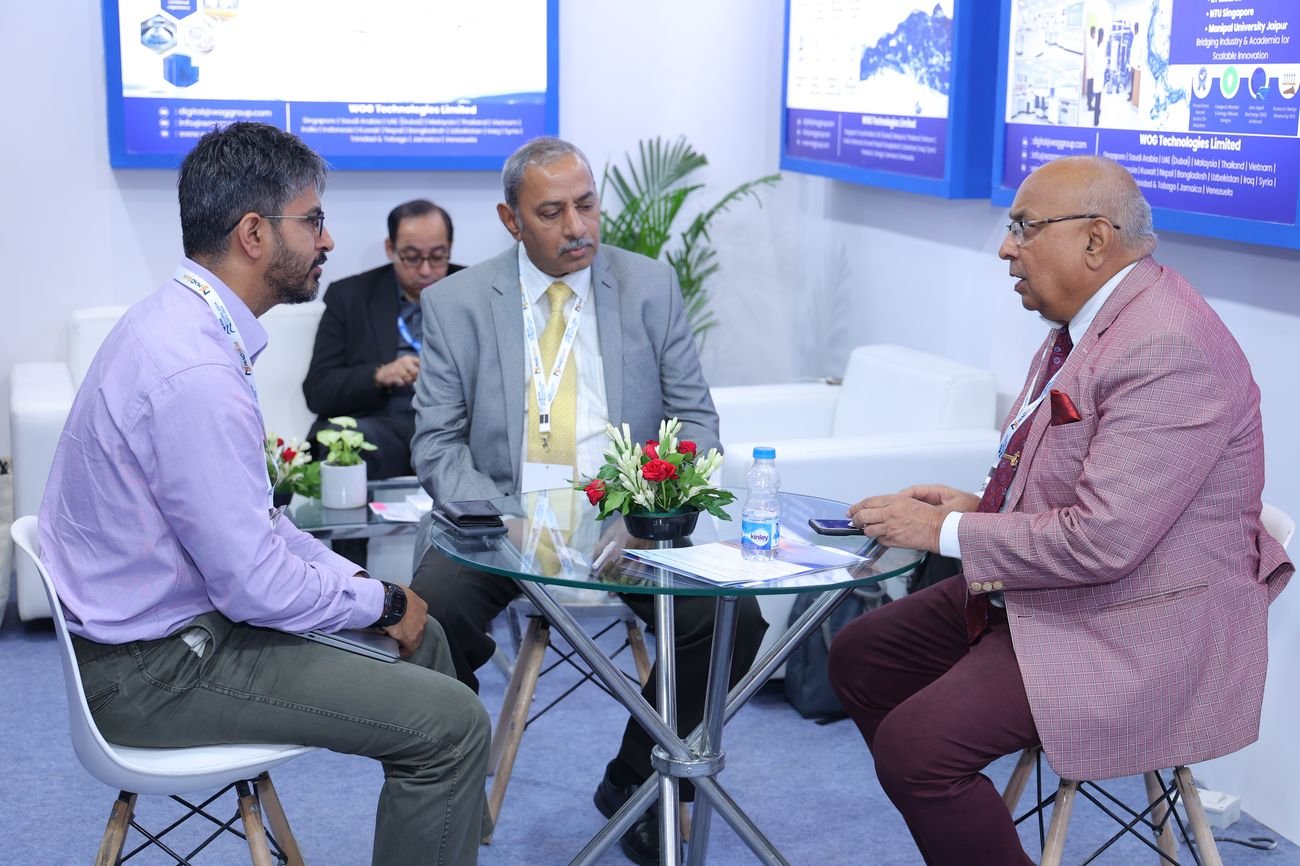
What business took place. 242 scheduled business meetings were held in the Global Water Business Lounge across the three days, an average of 81 per day and 1.77 per exhibiting stand. The Innovation Spotlight Arena delivered 38 product launches, live demonstrations and technical presentations. The EAW Water Leaders Studio recorded 52 interviews with CEOs, policymakers, utility leaders and international delegates. On the demand side, 1,116 visitors — 65.6% of everyone who answered the purpose-of-visit question — declared an explicitly commercial reason for attending. The show also generated more than 120 media placements across print, digital and broadcast.
Against the 2025 edition. Exhibiting companies rose from 130 to 159, an increase of 22.3%. Conference speakers rose from 21 to 55, an increase of 161.9%. Countries represented rose from 7 to 23. Of the 50 exhibitors named in the 2025 post-show report, 20 returned in 2026 — a 40% named-exhibitor retention rate. The more consequential change is one of method: 2026 is the first edition in which every headline figure can be reconstructed from a named list, a registration database or an operational record. No visitor comparison is drawn between the two editions, because the earlier figure was published without a stated counting basis. Section 05 sets this out in full.
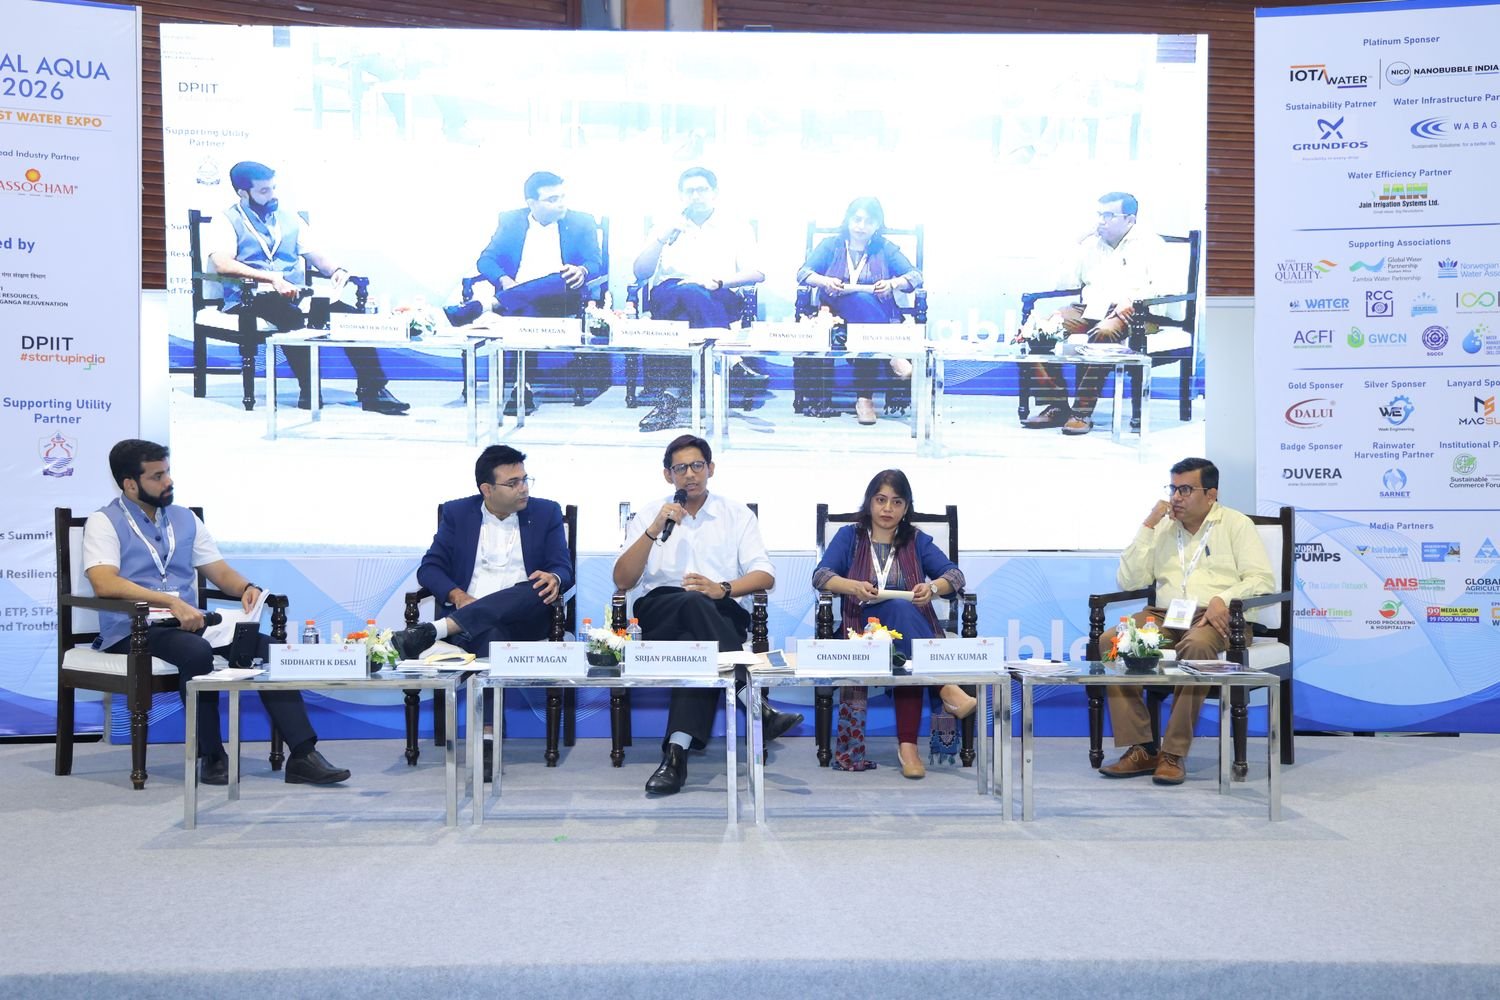
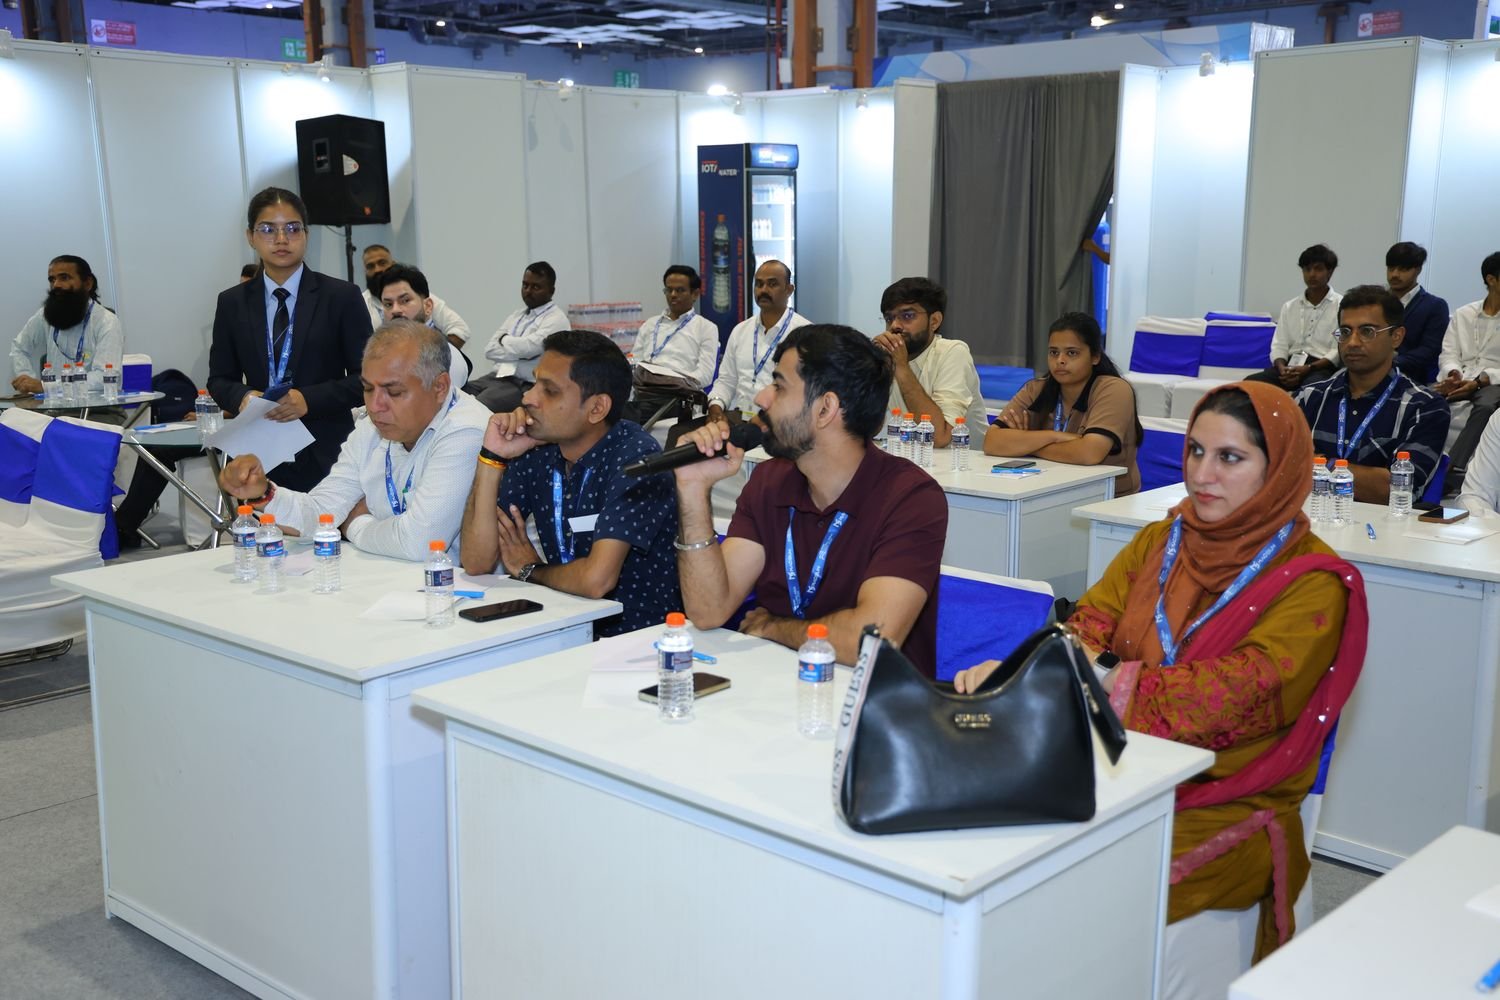
The knowledge programme. Fifty-five speakers were confirmed across a three-day conference with a deliberately different job each day. Day One, the ASSOCHAM Water Leaders' Summit, put policy, utilities, industry and capital in one room around the theme of India's water transition. Day Two turned outward — export competitiveness with SEPC, infrastructure financing with SCF Global and the Government of Jharkhand, and a South Asia Rainwater Forum convened by SARNET and Delhi Jal Board with speakers from Sri Lanka, Bhutan and Switzerland. Day Three belonged to the EAW Training Programme, a full-day paid masterclass on ETP, STP and ZLD design calculation and troubleshooting, completed by more than 50 certified delegates.
What the intent data shows. 1,702 visitors stated at least one reason for attending. Of those, 60.2% came to see the exhibition, 38.5% for business and networking, 35.3% to meet exhibitors and suppliers, and 31.6% to source new technologies. Taken together, 1,116 visitors — nearly two-thirds of everyone who answered — declared an explicitly commercial reason for being there. A further 413 came primarily for the conference or the technical training. This is not a general-interest audience.
The concentration problem. 83.9% of Indian visitors came from the northern states, and 2,420 visitors — 61.6% of the total — came from Delhi NCR. Maharashtra, Gujarat, Karnataka, Tamil Nadu and Telangana, which between them hold the majority of India's industrial water demand, contributed 355 visitors in total, or 10.1%. For a Delhi-hosted edition this is a predictable and defensible outcome. For a platform describing itself as national, it is the clearest single opportunity in this dataset, and it is the strategic logic behind the addition of a Hyderabad edition in January 2027.
What it signals about the market. Three demand signals stand out. First, digital water is no longer a niche: 19 exhibitor listings in digital water, IoT, AI and automation put it second only to treatment plants, and one full conference session was dedicated to Smart Water 4.0. Second, reuse and circularity have moved from advocacy to procurement language, appearing across the Waste to Wealth panel, the rainwater forum and a full masterclass day. Third, the export conversation has matured — a dedicated World Sustainable Water Summit convened by SEPC under the Ministry of Commerce and Industry addressed standards, certification and market access for Indian manufacturers selling abroad, which is a different question from the one this sector was asking five years ago.
What this report does not claim. No transaction value, order value or business-generated figure appears anywhere in this document. A meeting is an opportunity, not a contract. Exhibitor satisfaction and lead-capture data The 120+ media figure is a count of placements across print, digital and broadcast. The Methodology section sets out what was verified and what was calculated.
Two tables, deliberately separated. The first contains figures verified from the source files. The second contains programme capacity that was published before the show and is reported as delivered activity.


These figures come from organiser operational records for the delivered event.
This report counts 5,261 unique registered visitors, each holding a distinct badge QR code and a distinct email address in the final registration database. That is the figure used throughout. It counts registered visitors only. It does not include exhibitor stand personnel, contractors, organiser staff, media or speakers, who were badged through separate processes for which no data was supplied. Total presence in the hall across three days was higher, once exhibitor personnel, contractors, organiser staff, media and speakers are added.
The 20th edition ran 28–30 August 2025 in Hall 12A at the same venue. Three metrics can be compared, and all three moved sharply upward. The more important change is not any single number. It is that 2026 is the first edition whose figures can be reconstructed from a source record.
| Metric | 2025 · 20th edition | 2026 · 21st edition | Change | % |
|---|---|---|---|---|
| Exhibiting companies | 130 | 159 | +29 | +22.3% |
| Conference speakers | 21 | 55 | +34 | +161.9% |
| Conference delegates | 279 | 363 | +84 | +30.1% |
| Countries represented | 7 | 23 | +16 | — |
| Named exhibitors returning | — | 20 of 50 | — | 40.0% |
The 2025 figures above are as published in that edition's post-show report. The 2026 figures are itemised: 164 organisations appear by name in the Official Show Directory v11, and 55 speakers appear by name on the final speaker list.
Every headline figure in this report can be reconstructed by someone outside the organisation. 5,261 visitors is a row count in a registration database with a unique badge QR code and a unique email address on every record and zero duplicates. 164 organisations is a named list. 55 speakers is a named list. 242 meetings, 38 launches, 52 interviews and more than 50 certifications are operational records held by the organiser. 2,500 square metres of exhibition space inside a 7,500 square metre footprint is a venue contract.
That is a different kind of claim to a headline number with no method behind it, and it is worth more commercially. An international exhibitor evaluating a first-time booking, a ministry deciding whether to lend its name, and a sponsor reporting internally on spend all need a figure they can check. From this edition forward, they have one.
The 2025 post-show report published a visitor figure without stating how it was counted — whether it represented unique registered individuals, total badge scans, or cumulative daily entries across three days.
A percentage calculated between an audited figure and an unaudited one is arithmetic without meaning, and publishing it would undermine every other number in this document. This report therefore draws no visitor comparison between the two editions and does not restate the earlier figure.
5,261 unique registered visitors is the baseline. It is stated on a defined basis that can be applied identically at Hyderabad in January 2027 and New Delhi in May 2027, which is what makes a genuine three-year trend line possible for the first time.
The conference is the clearest gain. Twenty-one speakers became 55, and the programme moved from a single conclave into six separately convened forums with ASSOCHAM, SEPC under the Ministry of Commerce and Industry, SCF Global with the Government of Jharkhand, SARNET and Delhi Jal Board. Institutional participation deepened in the same direction: a Union Minister as Chief Guest, a former Chief Secretary, a state Water Resources Department taking floor space, and an export promotion council running a summit and an export desk.
The floor grew too, and it broadened. 130 exhibitors became 159 exhibiting companies across 22 named product and solution categories, with 17 MSME enterprises supported under the Ministry of MSME's PMS Scheme, a Swiss Pavilion, and 18 international companies from eight countries. And for the first time the platform ran a measured business programme rather than an unmeasured one: 242 meetings, 38 launches, 52 recorded interviews.
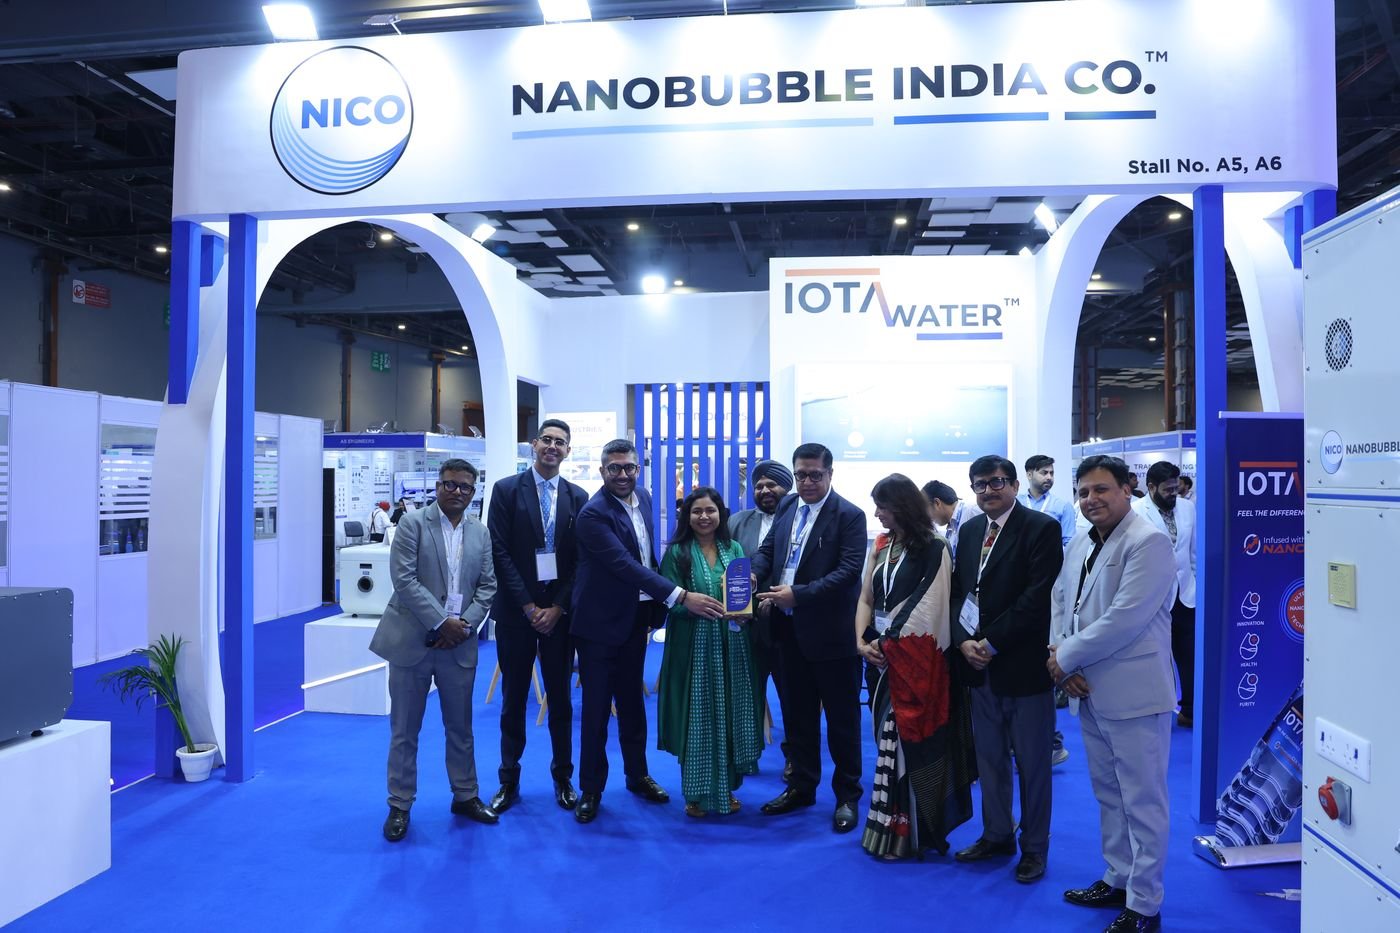
The 2025 post-show report named 50 prominent exhibitors and sponsors. Twenty of them returned to exhibit in 2026, a retention rate of 40% on the named list. Returning organisations include VA Tech Wabag, NICO Nanobubble India and IOTA, Jain Irrigation Systems, Delhi Jal Board, Doshion Polyscience, MMP Filtration, Murugappa Membranes, MacSun Technologies, Swan Environmental, Eltech Ozone, Energy Bots, Sustainico, Nanokriti, Neeway Projects, Wah Engineering, Mini Dose Solution Pumps, Integro Process Heating Solutions, Jinnys and the Water Management & Plumbing Skill Council. Sponsor continuity was also strong: NICO Nanobubble and IOTA held Platinum Sponsorship in both editions, and MacSun retained the Lanyard Sponsorship across both.
Calculated by matching the 50 organisations named in the 2025 post-show report against the 2026 Official Show Directory v11 exhibitor list. The 2025 list is described in that report as a selection rather than the full 130, so 40% is a retention indicator on the named set, not a total retention rate.
Meetings held and business generated are not the same thing, and this report keeps them separate. What follows is activity that took place, recorded by the organiser.


| Indicator | Value | What it means |
|---|---|---|
| Meetings held | 242 | Scheduled, matched meetings in the Global Water Business Lounge across three days |
| Per exhibiting stand | 1.77 | Average across all 137 organisations with allocated stands |
| Per show day | 81 | Sustained across all three days rather than concentrated on Day One |
| Against declared commercial demand | 21.7% | 242 meetings against 1,116 visitors who declared a commercial reason to attend |
The last line is the most useful one in this table, and it cuts both ways. A structured lounge converted roughly one in five declared commercial visitors into a scheduled meeting, which is a solid result for a first properly instrumented edition. It also means four in five commercially motivated visitors found their business on the floor, through the aisles and the Arena, rather than through the matchmaking process. Both routes work. Only one of them is currently measurable, and expanding lounge capacity is the obvious lever for 2027.
Delhi received effectively its entire average August rainfall inside the eight days that contained this Expo. The final show day was the wettest August day the capital had seen in two years. This section is here because any honest reading of the participation figures has to start with the weather.
The 2026 southwest monsoon was running hard over the National Capital Region in the first week of August. By the close of 8 August, the Safdarjung base observatory had recorded 230.1 mm of rainfall for the month against a 1991–2020 August normal of 226.8 mm. Delhi had taken a full month of rain in eight days, and those eight days contained this Expo. The India Meteorological Department subsequently corrected a logging error for 6 August, revising the month-to-date figure to 197.2 mm; this report uses the corrected data.
The heaviest spell arrived across Day Two and the early hours of Day Three. In the 24 hours ending at 08:30 on Saturday 8 August, Safdarjung recorded 98.7 mm — the heaviest August rainfall the capital had registered in two years. The last comparable August day was 1 August 2024, at 107.6 mm. Rain continued through Day Three trading hours.
Source: India Meteorological Department station data as reported. Lodhi Road is the observatory closest to Bharat Mandapam, Pragati Maidan, and recorded 86.8 mm in the same 24-hour period. A further 6.5 mm fell at Lodhi Road between 08:30 and 17:30 on 8 August — inside show hours.
608 visitors registered on Day One. 573 registered on Day Two, as the heaviest spell began. 538 registered on Day Three, a Saturday, with rain still falling and waterlogging across the approach routes into Pragati Maidan. Day Three held at 88% of the Day One figure. Alongside them, more than 50 delegates paid for and completed a full-day technical masterclass that ran from 10:00 to 16:30 on that same Saturday.
Trade exhibitions are usually judged on a number that assumes neutral conditions. This edition did not have neutral conditions, and that changes how the participation data should be read rather than excusing it.
Severe weather suppresses discretionary attendance first. The visitor who was going to drop in out of curiosity, the student with a free afternoon, the supplier with no particular meeting booked — those are the people who stay home when the underpasses flood. What survives a 98.7 mm day is attendance with a reason attached: a scheduled meeting, a specification to close, a supplier to qualify, a paid seat in a training room.
That is visible in the numbers this report has already set out, and the weather makes them read differently. 38.9% of visitors at owner, CXO, director or senior level. 65.6% of those who answered declaring a commercial purpose. 242 scheduled business meetings held. 232 industrial end users, 164 of whom registered on the floor rather than in advance. These are not the proportions of a walk-in crowd. They are the proportions of an audience that had somewhere specific to be.
This report does not claim the weather had no effect. It almost certainly cost the Expo visitors, and the counterfactual number — what attendance would have been under clear skies — cannot be calculated and is not estimated here.
What can be stated is what happened. Delhi took a month of rain in eight days. The final day was the wettest August day in two years. 1,111 people still registered across those two days, more than 50 paid for and sat through a six-and-a-half hour technical masterclass on the Saturday, and 242 business meetings were held across the three days.
For an exhibitor weighing a return booking, that is a more useful signal than a headline attendance figure taken in good weather. It is a measure of how much the market wanted to be in that hall.
The venue carried the conditions well. Bharat Mandapam's Hall No. 1 sits on the ground floor with direct access from the basement parking level, and the Supreme Court metro station on the Blue Line connects into the complex under cover. For an August edition in Delhi, that is not a small detail — it is the difference between a difficult day and a lost one, and it is a specific argument for retaining this venue for the August slot.
Each day was built to do a different job, and the registration data shows the audience responded to that structure rather than treating the three days as identical.


ASSOCHAM Water Leaders' Summit
Navigating India's Water Transition: Technology, Policy and Circularity
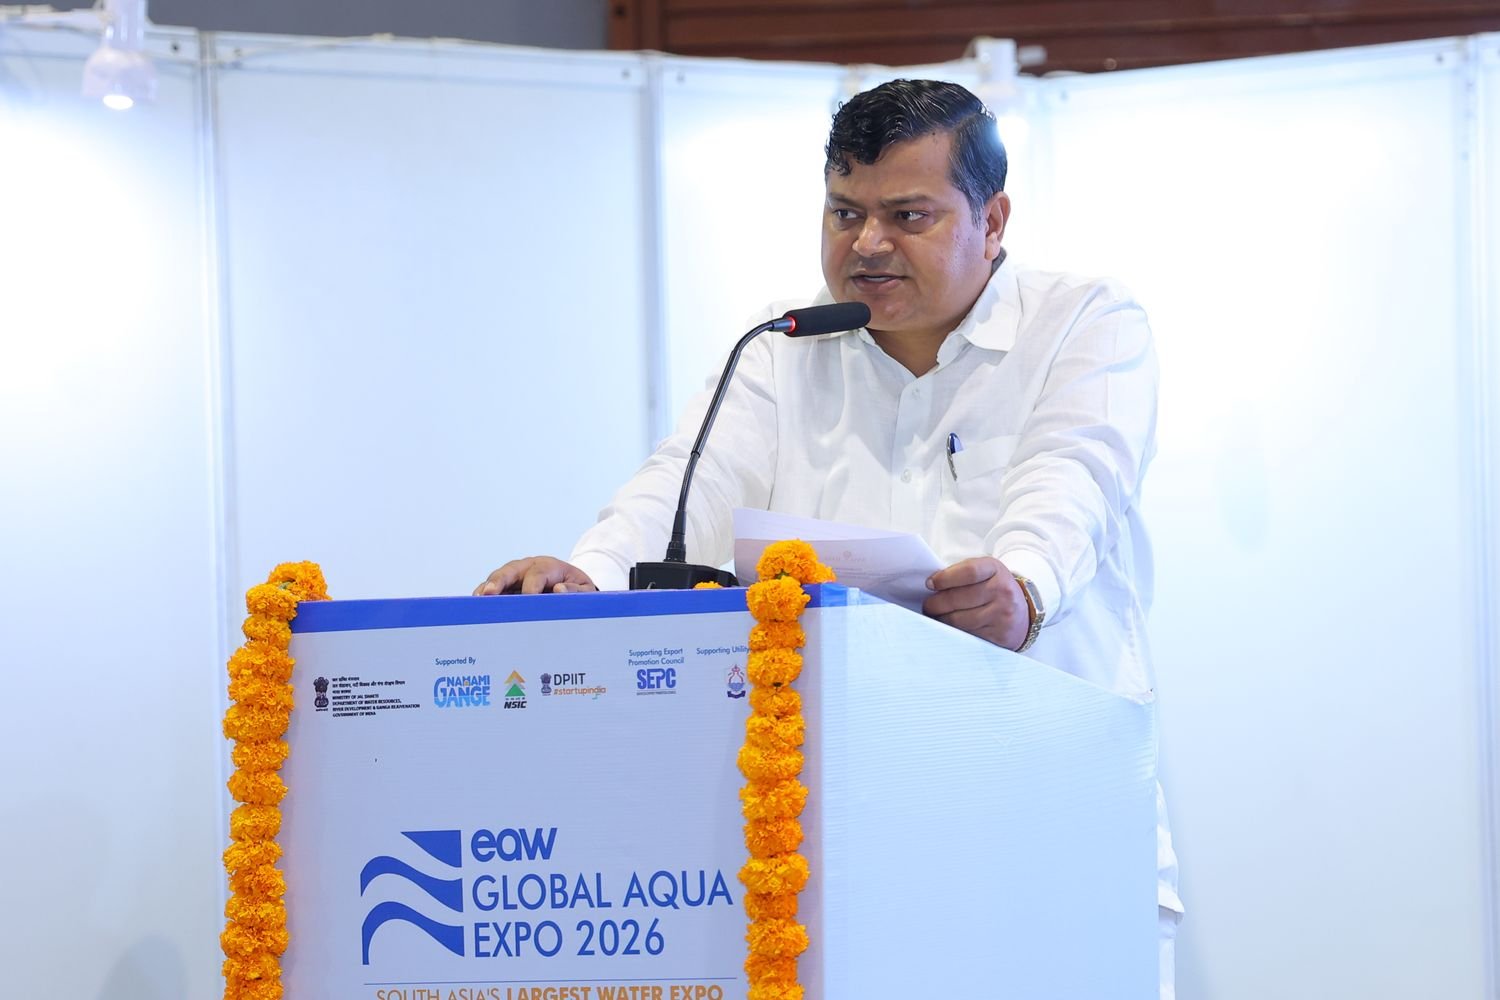
Opened with the Jal Kalash ceremony at 10:30 and the inaugural session, India Water Mandate 2030, with Dr. Raj Bhushan Chaudhary, Minister of State, Ministry of Jal Shakti, as Chief Guest. Five working panels followed through to 17:30: the CEO's Water Leadership Forum on industrial water security for Viksit Bharat 2047; industrial water capacity building and skill development; Smart Water 4.0 on AI; Waste to Wealth on the circular water economy; and Climate Ready on ESG, resilience and future infrastructure. The networking lunch was scheduled as a working session, The Water Marketplace in Action.
608 registrations completed on this day, under 18.7 mm of monsoon rain
Global Water Business and Resilience Day
Rainwater harvesting, water reuse and South Asia collaboration
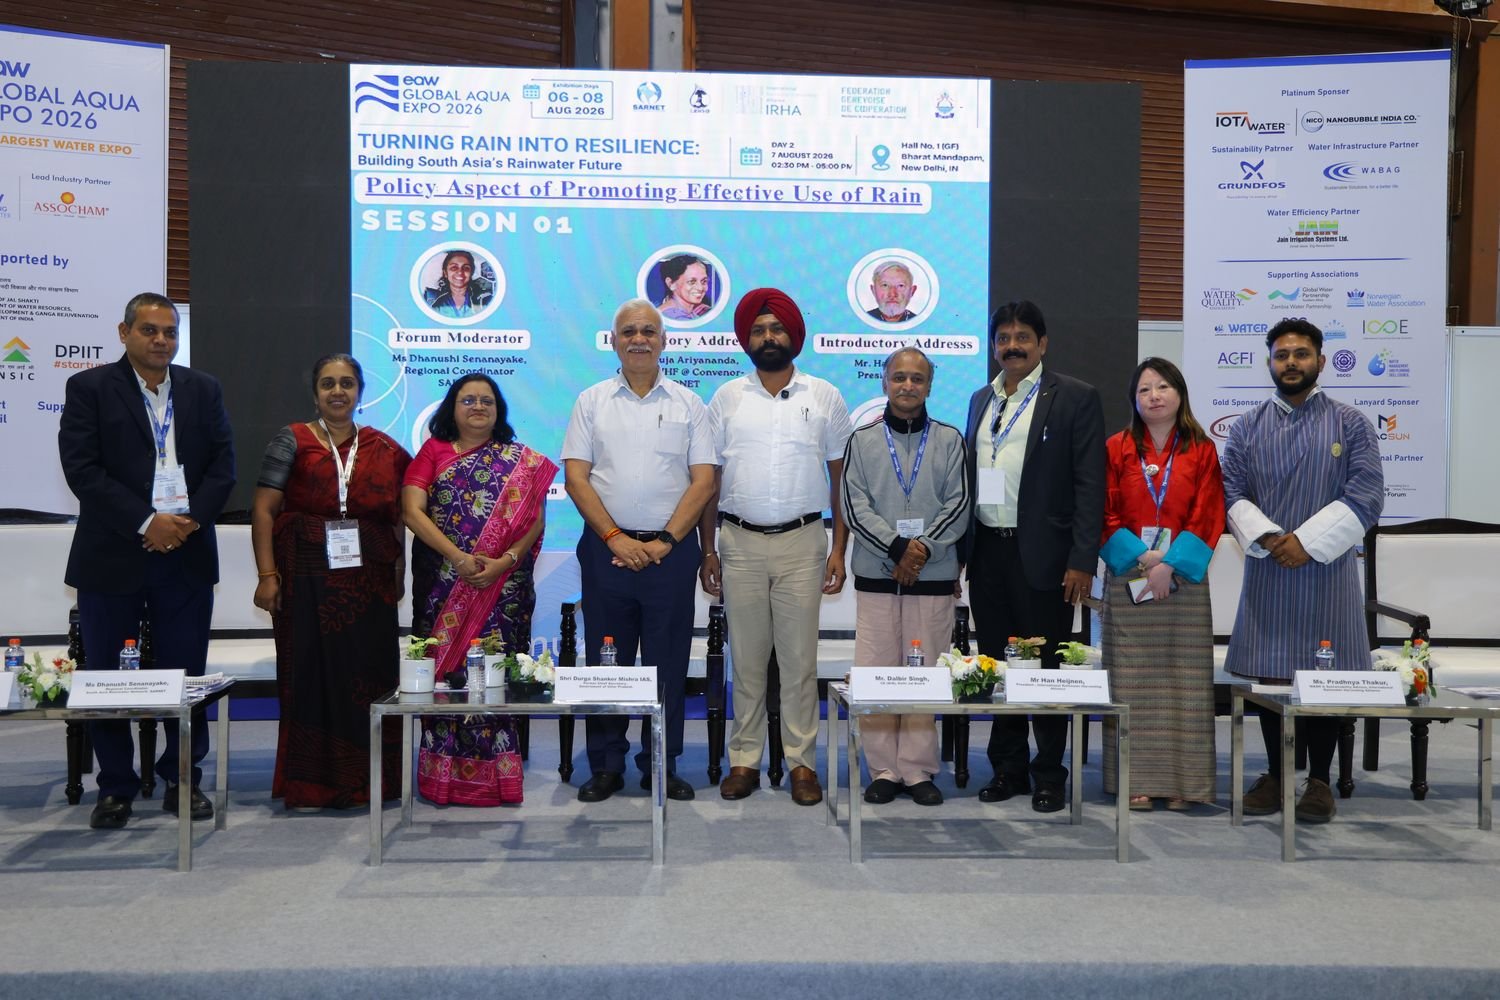
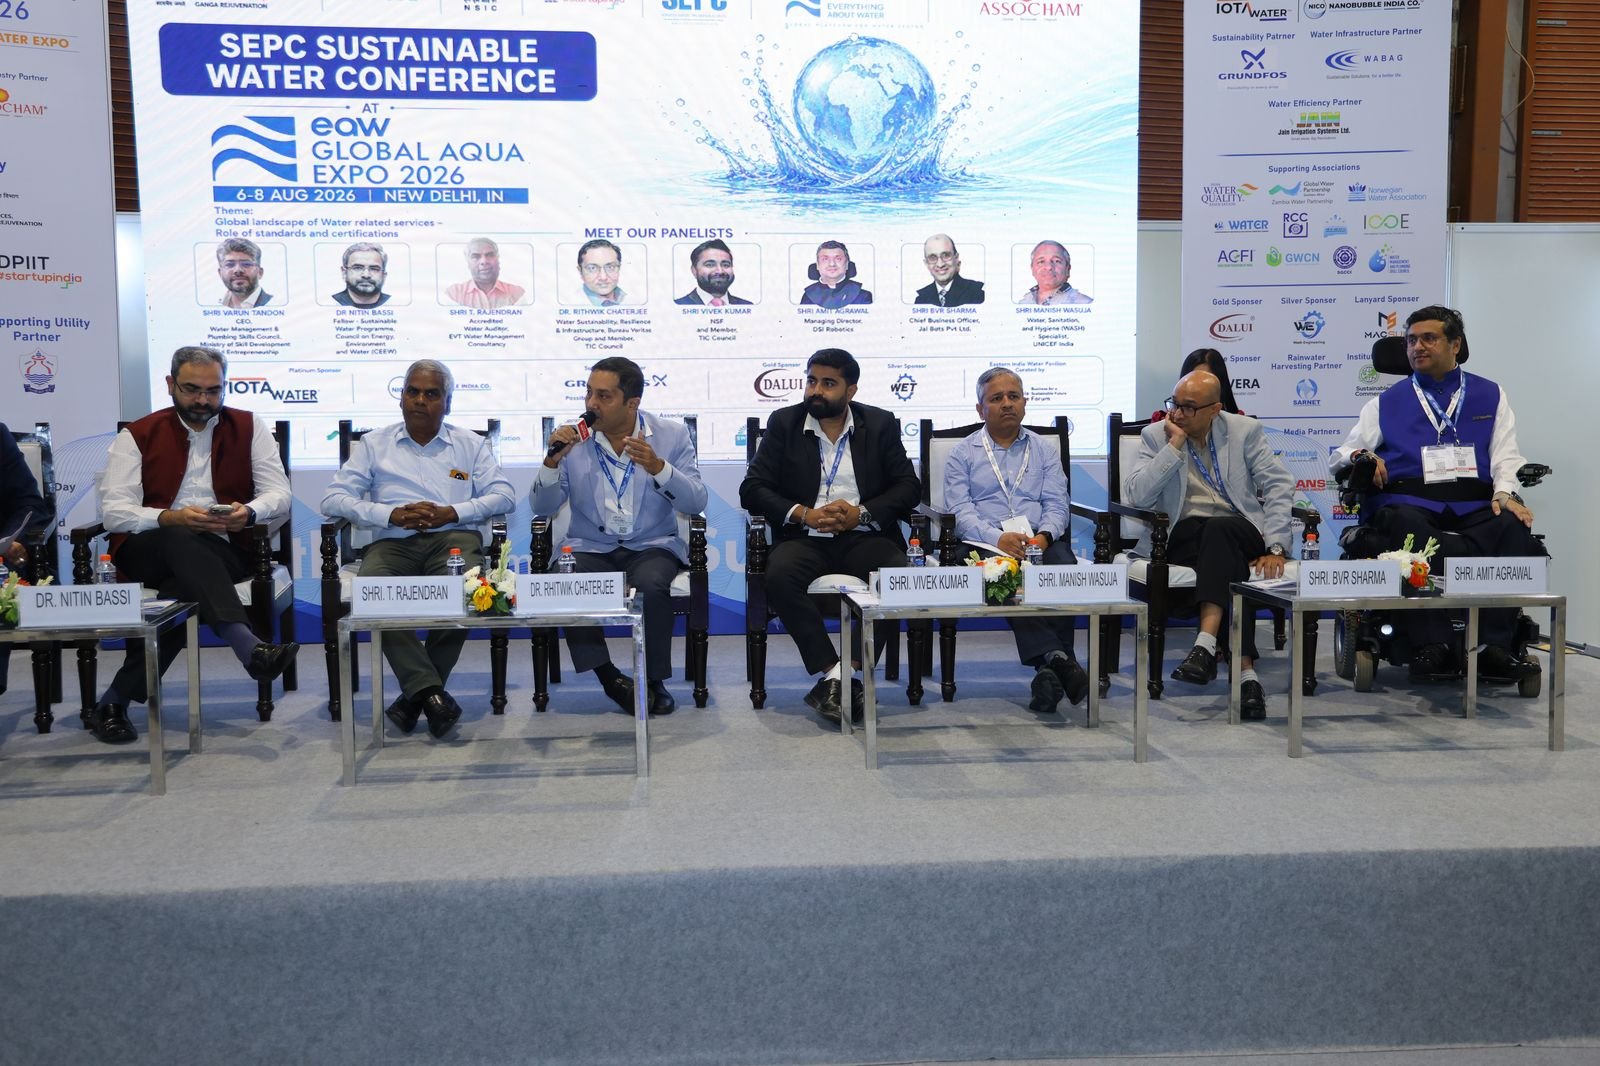
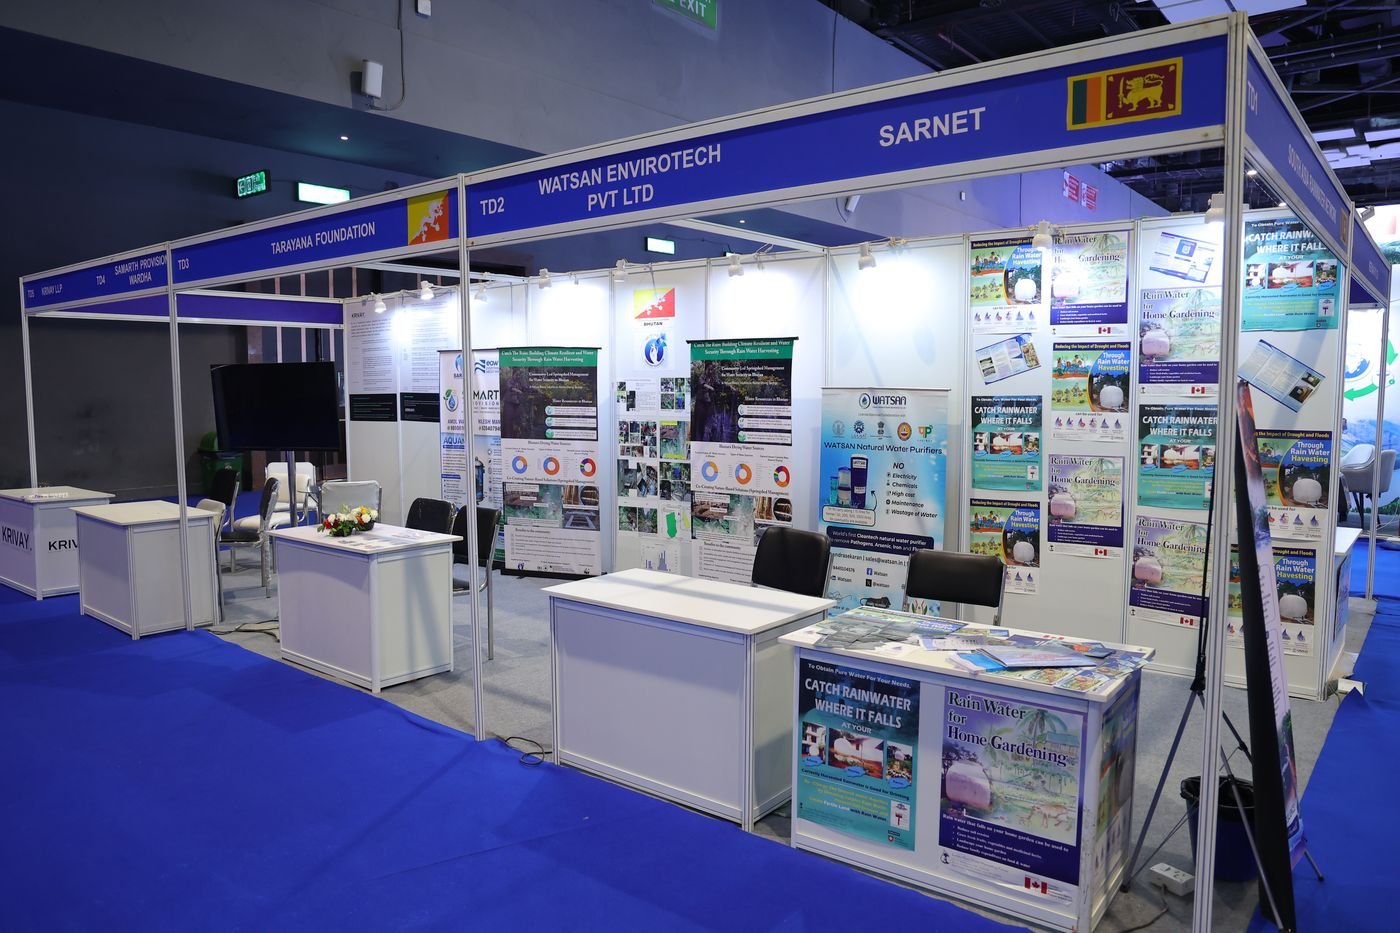
Three convened forums. The World Sustainable Water Summit, hosted by the Services Export Promotion Council under the Ministry of Commerce and Industry, addressed standards, certification and export competitiveness for Indian water companies, with WMPSC, CEEW, Bureau Veritas, NSF, the TIC Council, UNICEF India, DSI Robotics and Jal Bots on the panel. SCF Global, with the Water Resources Department of the Government of Jharkhand, covered financing and delivery. The afternoon belonged to the South Asia Rainwater Forum, convened by SARNET and Delhi Jal Board across three sessions on rainwater policy, resilient communities and innovation in harvesting technology.
573 registrations completed on this day, as the heaviest rainfall spell of the month began
EAW Water Academy
Future skills for the people who run the systems
A single full-day technical masterclass, 10:00 to 16:30, on ETP, STP and ZLD design calculation and troubleshooting. A paid programme with limited seats, built for plant engineers and operators, consultants and EPC teams, utility and municipal staff, industrial water managers, and young professionals and researchers. Participants received a certificate of participation. The exhibition floor and the Innovation Spotlight Arena ran alongside it.
538 registrations completed on this day — 88% of Day One, on the wettest August day in two years
The near-even split across the three days is worth noting. Many three-day trade exhibitions see a sharp Day One peak and a Day Three collapse. Here, Day Three still generated 538 new registrations — 88% of the Day One figure — despite Day Three being a Saturday, carrying a single paid technical masterclass rather than a headline policy summit, and taking place on the wettest August day the capital had seen in two years. The floor held its own audience under conditions that would have emptied a weaker one.
164 organisations, 137 of them with allocated stands, across 2,500 square metres of exhibition space within a 7,500 square metre total footprint in a single ground-floor hall.


The official Show Directory, version 11, is the authoritative exhibitor record for this edition. It lists 164 unique organisations. Of these, 137 held an allocated stand number and 27 participated without a dedicated stand — government bodies, associations, councils, chambers and media partners who convened sessions, hosted delegations or carried the show to their members.
That composition matters more than the headline count. A hall of 137 selling stands surrounded by 27 institutional participants is a different proposition to a hall of 164 vendors. The government bodies present without stands — the Ministry of Jal Shakti, Namami Gange, NSIC, DPIIT Startup India — are the reason a supplier on the floor could hold a conversation about scheme access and procurement pathways rather than only about product.
Directory entries divide into two groups by data quality. 92 organisations submitted their own company and product profile. For the remaining 73, the organiser compiled the entry from published information or from the exhibiting category, and each of those pages carries a note saying so. That is unusually transparent practice for a show directory and it is worth preserving.
Categories overlap: several association and government participants also held stands. 39 organisations in total are listed in the Directory's Industry Associations and Partners table.
| MSME enterprises under the PMS Scheme | 17 |
| International exhibiting companies | 18 |
| DPIIT-recognised startups on the Arena stage | 5 |
| Swiss Pavilion companies (stands A11–A12) | 5 |
| Table Display Zone participants | 5 |
| State government presence | 1 |
235 category listings across 164 organisations — an average of 1.42 categories each. The distribution is a direct read on where Indian water suppliers currently place their commercial bets.

Source: EAW Global Aqua Expo 2026 Official Show Directory v11, Find It by Product Category. Categories are assigned from each company's submitted profile, product description or published website. Companies appear in more than one category where their offer spans several.
Systems still outsell components. Treatment plants at 48 listings is nearly three times the next category. Indian water suppliers are still, predominantly, selling built solutions rather than parts into someone else's build. That is a market with room for component specialisation as EPC scale increases — and it is also why the pumps category, at six listings, looks thin against the size of the actual Indian pump market. Pumps buyers had fewer options on this floor than the sector's structure would predict.
Digital has crossed over. Digital water, IoT, AI and automation at 19 listings, plus instrumentation and metering at 17, environmental monitoring at 5, industrial automation and telemetry at 4, and water quality monitoring at 3, is a combined 48 listings in the measurement-and-intelligence layer. That is level with the entire treatment-plant category. Five years ago this would have been a corner of the hall.
The conservation and alternative-source cluster is small but present. Rainwater harvesting at 7 and atmospheric water at 3 are modest numbers, but both had disproportionate visibility in the programme — a full afternoon rainwater forum with international participation on Day Two, and two atmospheric water generation presentations on the Arena stage on Day One. That is a category where programme attention is currently ahead of exhibitor supply, which usually indicates an early-stage market rather than an unimportant one.
What was thin. Desalination did not appear as a standalone category. Neither did sludge-to-energy or resource recovery as distinct classifications, though both were addressed in the Waste to Wealth conference session. For a Delhi edition serving an inland northern catchment this is expected. For the Hyderabad edition and for any coastal-market positioning, it is a visible gap in the exhibitor mix.
Every record in the final visitor database carries a unique badge QR code and a unique email address. There are no duplicate registrations in the dataset.

1,811 visitors (51.3%) pre-registered between 21 July and 5 August. 1,719 (48.7%) registered during the show itself — 608 on Day One, 573 on Day Two and 538 on Day Three.
A near 50/50 pre-registration to on-site split tells two stories at once. On the positive side, the show generated substantial walk-in demand from a market that was reachable at short notice — a strong signal for a Delhi edition and for the value of the venue. On the operational side, half the audience arrived without any pre-show profiling, which means half the audience could not be matched to exhibitors, invited to relevant sessions, or routed to the business lounge before they walked in.
Comparing the pre-registered and on-site cohorts produces one of the most commercially useful findings in this dataset.
The on-site cohort was more operational and more public-sector. Industrial end users more than doubled on site (164 against 68 pre-registered). Water and wastewater companies rose from 300 to 456. Government departments went from 68 to 85, municipal corporations and utilities from 40 to 69, and PSUs from 26 to 36.
The pre-registered cohort was more advisory and more academic. Consultants (160 against 124), startups (138 against 114), research institutions (105 against 77) and students (97 against 45) all skewed toward advance registration.
The practical implication is direct: the buyers who matter most to exhibitors — plant operators, utility engineers, municipal staff — are the least likely to pre-register and therefore the least likely to be captured by any matchmaking process that depends on advance data. Reaching them requires the utility, industry-association and government channels rather than the online form.
1,691 visitors declared at least one industry segment at registration, making 3,191 selections between them — an average of 1.37 segments each. Percentages below are of those 1,691 respondents.
Multi-select field. Percentages sum to more than 100 because 550 visitors selected more than one segment. 1,208 visitors (34.2% of all registrations) made no segment selection and are classified as Other — see Section 27.
Counted as unique visitors rather than as selections, the audience separates into three commercially distinct groups. This is the number an exhibitor should be looking at when deciding whether the audience justified the stand.
22.1% of all visitors
Government departments, municipal corporations and utilities, PSUs, industrial end users, EPC contractors and consultants. These are the organisations that specify, tender, procure or operate. Counted once each, regardless of how many segments they ticked.
30.3% of all visitors
Manufacturers and technology providers, distributors and dealers, and startups. A high supply-side count at a trade exhibition is normal and not a fault — suppliers walk competitor floors, scout partners and recruit channel. 157 visitors appear on both sides.
38.4% of all visitors
The demand side plus water and wastewater companies — treatment operators, service providers and O&M firms, who buy equipment, chemicals, membranes and instrumentation to deliver their own contracts. This is the realistic addressable audience for most exhibitors on this floor.
Share of each segment holding an owner, founder, proprietor, partner, CXO, director or senior-management title. This is where the quality of an audience becomes visible.
| Segment | Visitors | Senior-level share |
|---|---|---|
| EPC Contractor | 89 | 53.9% |
| Distributor / Dealer | 232 | 52.6% |
| Manufacturer / Technology Provider | 698 | 46.4% |
| Startup | 252 | 46.4% |
| Water & Wastewater Company | 756 | 45.9% |
| Consultant | 284 | 45.8% |
| Industrial End User | 232 | 44.8% |
| Municipal Corporation / Water Utility | 109 | 42.2% |
| PSU | 62 | 32.3% |
| Research / Academic Institution | 182 | 27.5% |
| Government Department | 153 | 24.8% |
| Student | 142 | 4.9% |
Two readings. First, the commercial segments cluster tightly between 44% and 54% senior representation — this was not a delegation of junior staff sent to collect brochures. Second, the public-sector segments sit lower, at 25% to 42%. That is normal for government participation at trade shows, where technical and executive-engineer grades attend and decisions route upward, but it is a specific argument for a hosted-delegation programme aimed at senior utility and municipal leadership in future editions.
23 Indian states and union territories, 788 cities and 12 countries. Also: the most concentrated result in this dataset, and the clearest strategic signal in it.
Teal bars mark the five states that together hold the majority of India's industrial water demand.
| City | Visitors | Share |
|---|---|---|
| New Delhi | 1,470 | 41.6% |
| Noida | 276 | 7.8% |
| Gurugram | 216 | 6.1% |
| Ghaziabad | 129 | 3.7% |
| Faridabad | 94 | 2.7% |
| Greater Noida | 50 | 1.4% |
| Mumbai | 45 | 1.3% |
| Jaipur | 41 | 1.2% |
| Ahmedabad | 39 | 1.1% |
| Panipat | 38 | 1.1% |
| Kanpur | 32 | 0.9% |
| Pune | 32 | 0.9% |
Panipat, Ludhiana, Kanpur, Agra, Meerut, Bahadurgarh and Sonipat all appear in the top 20 — textile, leather, chemical and light-engineering clusters with direct effluent-treatment obligations. That is a meaningful signal about who was walking the floor.
Base: 4,082 Indian visitor records. 16 records had no usable state value.
A 61.6% NCR share is not a failure. It is what a Delhi-hosted August edition should look like, and it is a genuine asset: Bharat Mandapam sits inside the largest concentration of water policy, utility headquarters, EPC head offices and ministry decision-making in the country, and the Day One programme was built for exactly that audience. But it does set the limit on what this edition can honestly claim. A show where 5 of 6 Indian visitors come from one region is a strong regional platform with national institutional reach, not yet a nationally distributed audience. Every forward-looking recommendation in Section 32 follows from that single number.
An analytical principle, not a claim that every visitor was a decision-maker. 4,918 of 5,261 records carried a stated designation. Those titles were normalised and banded.


1,454 visitors — 38.9% of all registrations — held owner, CXO, director or senior-management titles. Excluding the 496 records where no usable designation was given, that share rises to 45.3% of visitors with a classifiable title.
Both numbers should be published together. The first is the conservative figure and the one to quote externally. The second is the more accurate description of the people who actually identified themselves.
For context, the profile is heavily weighted toward small and mid-sized enterprise leadership: 274 visitors gave their title simply as "Director", 151 as "Owner", 164 as "Proprietor" or "Prop", 85 as "CEO", 60 as "Partner" and 59 as "Founder". In the Indian water equipment market — where MSMEs form the bulk of the supply chain and the buying chain for smaller plants — the owner is the decision-maker. There is no procurement committee to route around.
The practical question an exhibitor asks after a show is whether the people at the stand could say yes. On this floor, roughly two in five could — and among the segments most likely to buy, closer to one in two.
The weakest link is government. 153 government-department visitors at 24.8% senior level and 109 municipal or utility visitors at 42.2% is participation, but it is not yet leadership-level engagement at the scale the programme content justified.
1,702 visitors (48.2%) answered the purpose-of-visit question, selecting 2.10 reasons each on average. Percentages are of those 1,702 respondents.

65.6% of respondents · 31.6% of all visitors
Visitors selecting at least one of: sourcing new technologies, meeting exhibitors and suppliers, business and networking, or partnership opportunities. This is the number that answers an exhibitor's real question.
24.3% of respondents · 11.7% of all visitors
Visitors selecting the conference, the technical training programme, or both. 146 selected both, which is a strong overlap and supports keeping conference and training bundled rather than split across separate audiences.
Two observations that carry commercial weight. First, partnership intent under-indexes at 11.5%, and it collapses among on-site registrants — 158 of the 195 who selected it had pre-registered. Partnership-seeking is a planned activity, not a walk-in one, which is an argument for a formal pre-matched partnership programme rather than relying on the floor. Second, the training programme drew 245 declared registrations of interest against a Day Three masterclass with limited paid seats. Whatever the final certified number, declared demand comfortably exceeded a single-room capacity. That is a product with room to expand.
The programme was not a single conference stretched over three days. It was three separately convened platforms, each with a different partner, a different audience and a different job.

Classified from the final speaker list by the organisation each speaker represented. Where a speaker holds roles in more than one organisation, the primary affiliation stated on the list is used.
Dr. Raj Bhushan Chaudhary, Hon'ble Minister of State, Ministry of Jal Shakti, Government of India, as Chief Guest. Shri Durga Shanker Mishra, IAS, former Chief Secretary, Government of Uttar Pradesh. Shri Dalbir Singh, Chief Engineer (W/B), and Mr. Anirudh Dube, Executive Engineer, Delhi Jal Board. Shri Abhishek Minz, Superintending Engineer, Water Resources Department, Government of Jharkhand. Mr. Nilesh Mankar, Groundwater Survey and Development Agency, Government of Maharashtra. Shri Varun Tandon, CEO, Water Management & Plumbing Skill Council, Ministry of Skill Development and Entrepreneurship. Dr. Shiv Singh Rawat, former Superintending Engineer, Haryana Irrigation Department.
VA Tech Wabag, SUEZ India, Grundfos, Jain Irrigation, IOTA Group and NICO Nanobubble, WOG Group and WOG Technologies, KISHOR Pumps, Cosmos Pumps, Microfilter Polymers, Aqua-Aerobic Systems, GM Dalui & Sons, ITRON, Nobel Software Systems, ParyAI Solutions, Yara Fertilizers, DSI Robotics, Jal Bots, Hansamkora, NeeRain, Watsan Envirotech, Gatisheel Agritech and Farmland Rainwater Harvesting Systems.
ASSOCHAM, represented across four speakers including the Assistant Secretary General and both Co-Chairs of the National Council on Water. Council on Energy, Environment and Water (CEEW). Centre for Science and Environment. UNICEF India. Bureau Veritas and NSF, both also representing the TIC Council. Water Management & Plumbing Skill Council. SARNET. SCF Global. WICCI Water Resources Council. IIT Delhi. TERI School of Advanced Studies. S.M. Sehgal Foundation, Navjyoti India Foundation, National Agro Foundation, Centre for Water Peace and Masharnagat Sewa Foundation.
Mr. Han Heijnen, President, International Rainwater Harvesting Alliance, Geneva. Dr. Tanuja Ariyananda, CEO, Lanka Rainwater Harvesting Forum and Convenor, South Asia Rainwater Network, Sri Lanka. Ms. Karma Uden, Senior Programme Officer, Tarayana Foundation, Bhutan. Ms. Dhanushi Senanayake, Coordinator, SARNET. Ms. Cho Minsoo, Hansamkora, South Korea. Ms. Pradnya Thakur, WASH and Sustainability Advisor, IRHA.
Recognition on the platform: Padma Shri Uma Shankar Pandey, water conservationist and national awardee, spoke on Day Two.
Fifty-five speakers appeared on the final conference programme, drawn from government and public bodies, industry leadership, institutions and standards bodies, and international participants.
Seven themes carried across the programme. Each is drawn from a named session, not inferred.


The CEO's Water Leadership Forum was framed around driving industrial water security for Viksit Bharat 2047, moderated by Mr. Shankar Venkateswaran with IOTA Group, WOG Group, VA Tech Wabag and Microfilter Polymers. The framing is significant: water was positioned as a strategic input constraint on industrial growth, not as a compliance overhead.
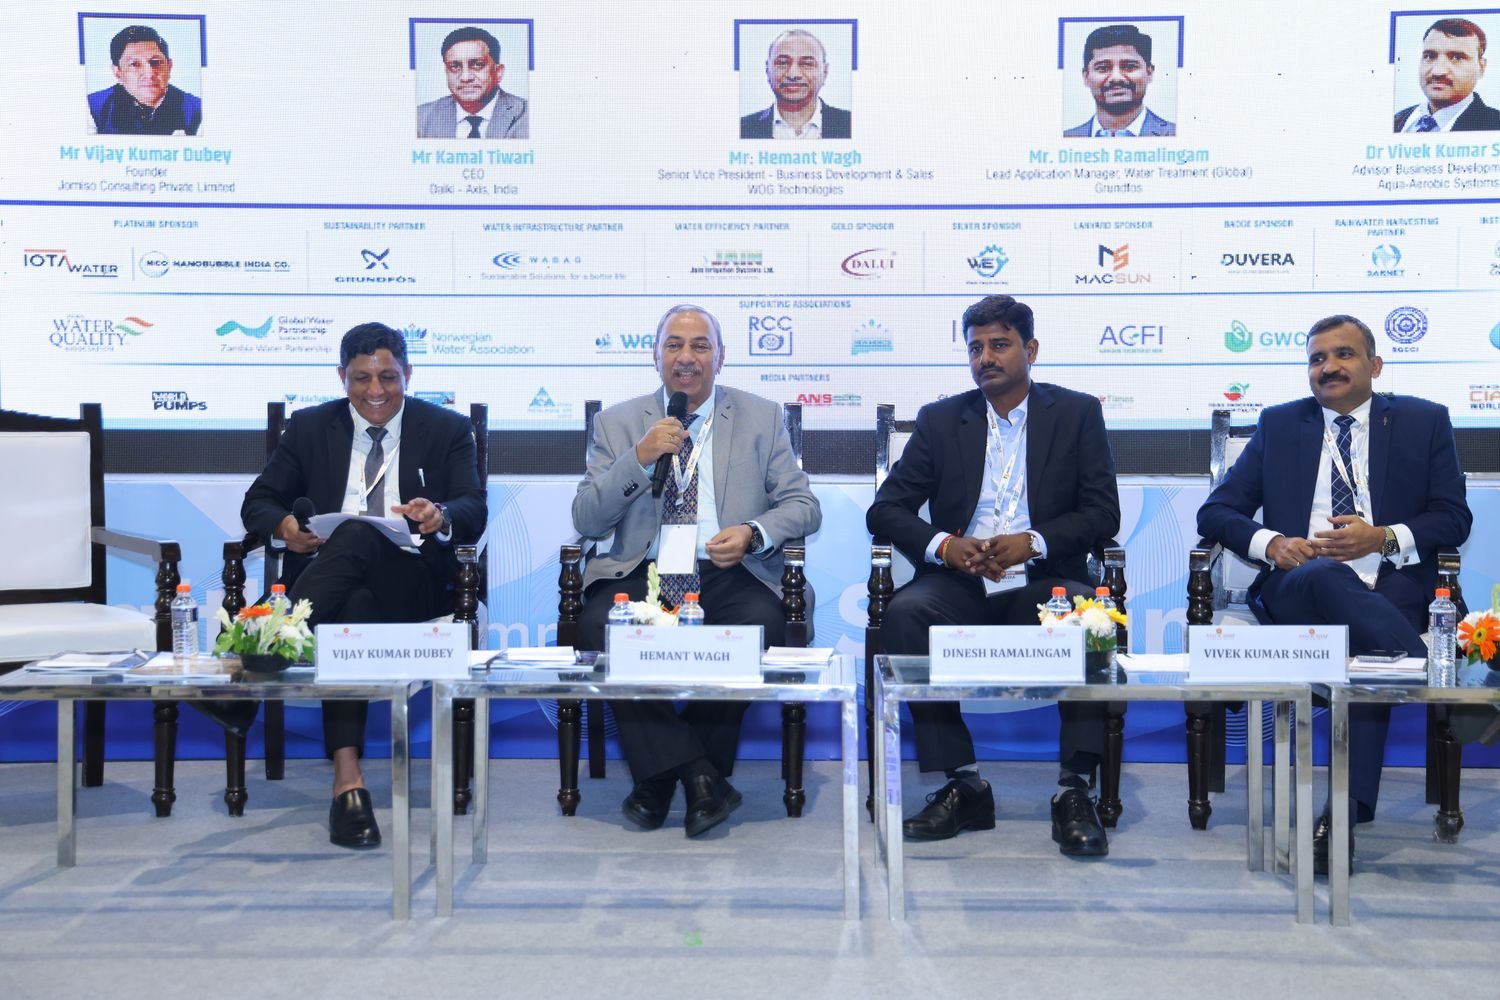
The Waste to Wealth session, moderated by Mr. Turbaashu Bhattacharya with Daiki Axis India, Aqua-Aerobic Systems, Grundfos and WOG Technologies, addressed building India's circular water economy. The Directory's own framing is blunt and worth quoting as the sector's current position: reuse is the cheapest new source of water any industrial site has, the technology is proven, and what needs building is the business case.
A dedicated AI session, keynoted by Mr. Anirudh Dube of Delhi Jal Board, with ParyAI, ITRON, Nobel Software Systems and GM Dalui & Sons. The exhibitor data supports the programme choice: measurement and intelligence categories together matched the treatment-plant category in listings. The open question the programme identified is not whether sensors and telemetry work, but who owns the data they generate.
The World Sustainable Water Summit, convened by the Services Export Promotion Council under the Ministry of Commerce and Industry, put standards, certification and export readiness at the centre of Day Two — with Bureau Veritas, NSF and the TIC Council on the panel alongside WMPSC, CEEW, EVT Water Management Consultancy, DSI Robotics, Jal Bots and UNICEF India. The question being asked was specific: what does an Indian water company need in order to sell services abroad.
SCF Global with the Water Resources Department, Government of Jharkhand, ran a session on financing, delivering and sustaining India's water infrastructure, with IIT Delhi, Centre for Water Peace, Canara Bank and independent WASH and carbon advisors. Bringing a commercial bank onto a water infrastructure panel is a small detail that says something about where the constraint now sits.
The South Asia Rainwater Forum, convened by SARNET and Delhi Jal Board across three sessions, covered policy, community participation and behavioural change, and innovation in harvesting technology — with the International Rainwater Harvesting Alliance, the Lanka Rainwater Harvesting Forum, Tarayana Foundation of Bhutan, Centre for Science and Environment and the Government of Maharashtra. This was the most internationally constituted content block of the three days.
Capacity building appeared twice and in two different registers: as a Day One policy panel on industrial water capacity building and skill development, with the Water Management & Plumbing Skill Council, SUEZ India, TERI School of Advanced Studies and Navjyoti India Foundation; and as an entire Day Three, given over to a technical masterclass on ETP, STP and ZLD design and troubleshooting. A programme that spends a third of its floor-time on training is making a statement about what it believes the sector's actual bottleneck is.
A full day, 10:00 to 16:30 on Saturday 8 August, on ETP, STP and ZLD design calculation and troubleshooting. Paid, limited seats, certificate on completion.

Most exhibition training is a promotional session in a side room. This was not that. It occupied the entire Day Three conference programme, it was a paid product with capped seats, and its stated outputs were design calculations participants could apply, troubleshooting methods for live plants, compliance and ZLD practice, and a certificate of participation.
The subject choice is the point. ETP, STP and ZLD design calculation and troubleshooting is the specific, unglamorous competence that determines whether an installed treatment asset actually meets discharge norms over a thirty-year life. It is also the competence India's water sector is shortest of. Plants get built. Plants underperform. The gap between those two facts is usually design assumptions and operator capability, not equipment.
245 visitors selected the technical training programme as a reason for attending — 14.4% of everyone who answered the purpose question. 146 of them also selected the conference, meaning the training audience and the conference audience overlap heavily rather than being separate populations.
162 of the 245 pre-registered, and 83 registered on site. Training interest, unlike walk-in exhibition interest, is a planned decision.
245 visitors declared training as a reason for attending. More than 50 paid delegates completed the programme and received certificates. That is a conversion of roughly one in five from declared interest to paid enrolment, in a single room with capped seats — and it means around 195 people who told us they wanted technical training did not receive it at this edition.
This is the clearest capacity constraint in the entire dataset, and the cheapest to fix. Running the masterclass twice, or splitting it into a municipal-utility track and an industrial track, would serve demand that has already declared itself. Certification records also give the platform its most defensible knowledge-value metric, and they should be captured and reported at every edition from here.
A structured meeting zone on the right side of Hall 1, running all three days, built around scheduled pre-matched meetings rather than chance encounters. 242 meetings were held.


A four-step process: register a requirement at the organiser desk or with the lounge team; receive a shortlist matched against exhibitors on the floor with availability; meet at a lounge table in fifteen to thirty minute slots away from the aisles; agree a next step before leaving the table.
Alongside the lounge sat the EAW Water Leaders Studio, which recorded 52 interviews with CEOs, policy makers, utility leaders, researchers and international delegates across the three days.
242 meetings took place across the three days, an average of 81 a day and 1.77 per exhibiting stand. That is a record held by the organiser and it is stated as such.
No transaction value, order value or business-generated figure appears anywhere in this report. A meeting is an opportunity, not a contract, and the organiser holds no record of what was signed afterwards. Exhibitors who closed business from this edition are invited to report it; it will be attributed and published in future editions rather than estimated here.
| Visitors declaring a commercial reason to attend | 1,116 |
| Visitors intending to meet exhibitors or suppliers | 600 |
| Visitors intending to source new technologies | 537 |
| Visitors seeking partnership opportunities | 195 |
| Demand-side visitors (govt, utility, PSU, industry, EPC, consultant) | 781 |
| Broad buyer pool including W&W operators | 1,355 |
| Organisations with allocated stands to meet them | 137 |
| Meetings actually held in the lounge | 242 |
Read as a ratio: roughly eight declared-commercial visitors per stand, and 1.77 scheduled lounge meetings per stand. A 21.7% conversion from declared commercial intent to a booked meeting is a solid first instrumented result and a clear expansion target.
The lounge was instrumented for the first time this year, which is why this report states a measured figure. The next step is to record buyer organisation, exhibitor and agreed next step against each meeting. A show that can report "242 meetings between 137 exhibitors and 190 named buying organisations, of which 61 recorded an agreed next step" is selling something an international exhibitor can price. That is one extra column on a form the team already fills in.
Twenty-minute slots in a 9 × 10 metre space beside the business lounge. Open seating, no registration, running through exhibition hours on all three days.


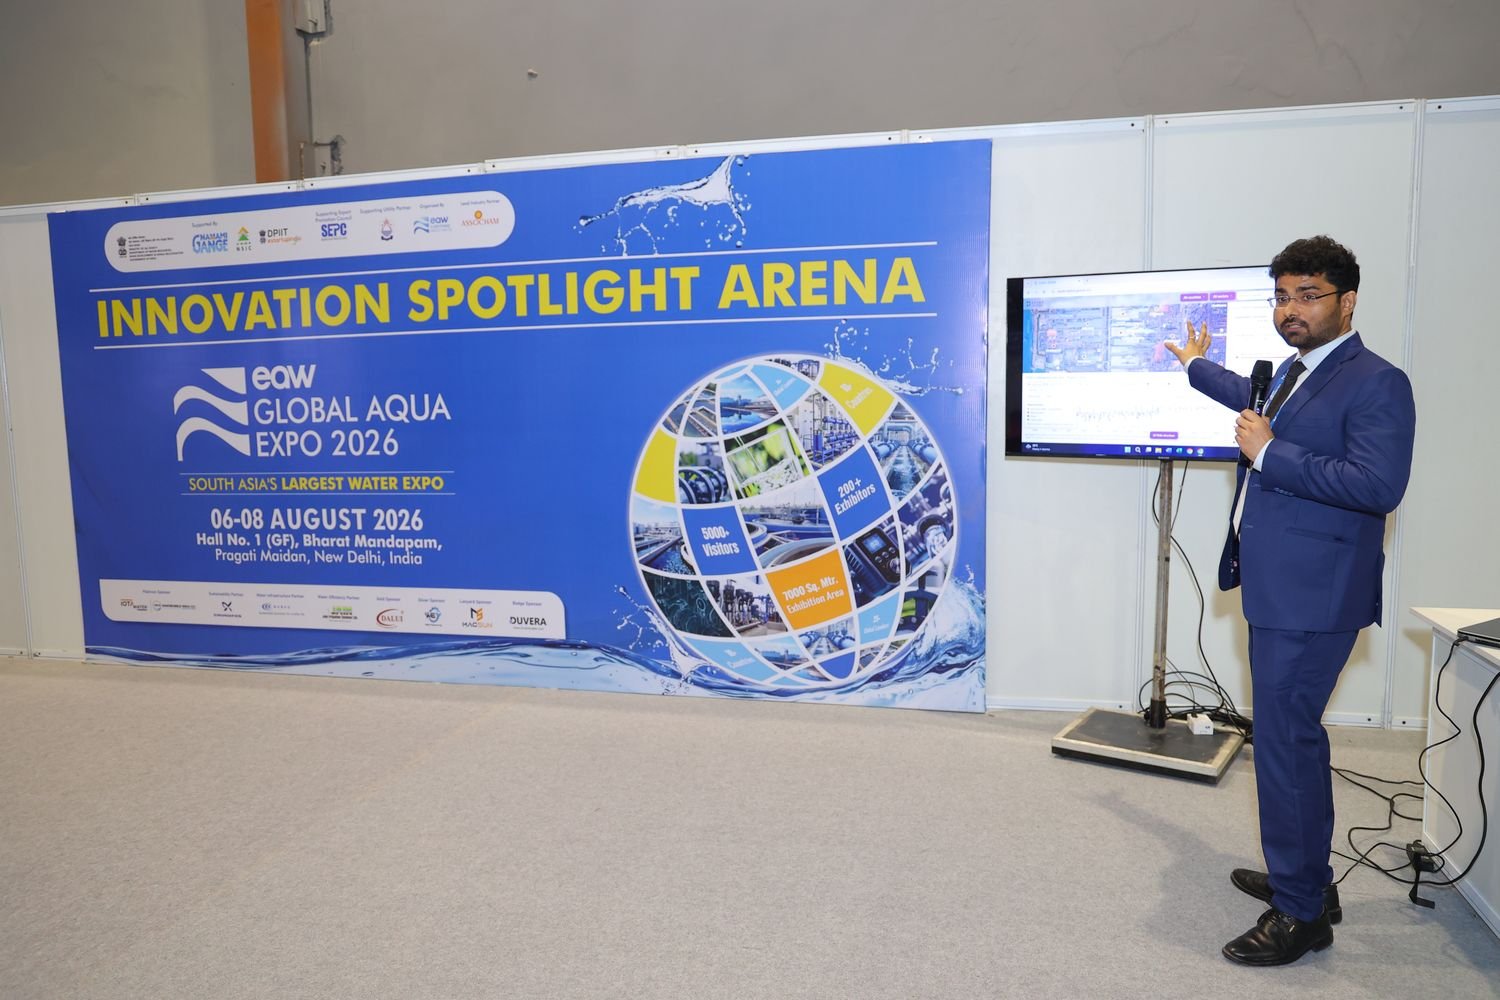
The Arena's design principle is stated plainly in the Show Directory and is worth repeating because it is the correct one: a brochure tells you what a product claims, a demonstration tells you whether it works, and the Arena gives an unknown company the same twenty minutes as a global one in front of people who sign purchase orders. Across the three days it delivered 38 product launches, live demonstrations, startup pitches and technical presentations — an average of nearly 13 a day, and above the level the show was built toward.
The Day One confirmed programme gives an accurate picture of what that produced in practice — a mix of established manufacturers, technical specialists and retired utility engineers, not a startup showcase:
| Day One presentation | Presenter |
|---|---|
| Opening Ceremony | EAW Global Aqua Expo |
| Pharma ETP solutions | Mr. Ritam Kar, Sundarban Chemicals |
| Integrated water management | Ms. Poonam Pandit, Wire Consultancy |
| Integrated water resources management | Er. R. K. Singhal, Delhi Jal Board (retd.) |
| Eco-intelligent wastewater and solid waste | Mr. Sanjay Aggarwal, Biomatix Eco-Solutions |
| Atmospheric water generators | Capt. K. K. Sharma, Maithri Aquatech |
| Atmospheric water generation solutions | Mr. Ajai Singh, Maithri Aquatech |
Twelve slots were open for allocation on Day Two and four on Day Three at the time the Event Guide was published.
Atmospheric water generation took two of seven Day One slots. Against only three exhibitor listings in the atmospheric water and alternative sources category, that is programme attention running well ahead of exhibitor supply — the classic profile of a category the market is curious about but has not yet committed to.
Pharma effluent treatment led the technical content. Pharmaceutical manufacturing is among the most water-intensive and most tightly regulated Indian industrial segments, and it is concentrated in Hyderabad and Gujarat rather than the NCR. That is a direct argument for the Southern edition.
A retired Delhi Jal Board engineer on the launch stage is a useful marker of what the Arena actually became: less a pitch platform, more a technical exchange where practitioner credibility carried as much weight as novelty.
38 launches and presentations were delivered across the three days. The EAW Water Leaders Studio, sitting alongside the Arena, recorded 52 interviews with chief executives, policymakers, utility leaders and international delegates — an owned content asset with a working life far beyond the three days.
Seven government and public bodies participated directly, alongside sixteen associations and councils. This is the layer that distinguishes a market-access platform from a supplier hall.

| Ministry of Jal Shakti | Supporting |
| Namami Gange | Supporting |
| National Small Industries Corporation (NSIC) | Supporting |
| DPIIT Startup India | Supporting |
| Ministry of Micro, Small and Medium Enterprises | PMS Scheme |
| Services Export Promotion Council (SEPC), Ministry of Commerce and Industry | Stand B65 |
| Delhi Jal Board — Supporting Utility Partner | Stand A24 |
| Water Resources Department, Government of Jharkhand | Stand A9 |
Delhi Jal Board's participation extended beyond a stand: it keynoted the Smart Water 4.0 session, co-convened the South Asia Rainwater Forum with SARNET, and placed a Chief Engineer and an Executive Engineer on the speaker platform. It was also the single most represented organisation in the visitor database, with 23 registrations across name variants.
270 unique visitors identified themselves with a government department, municipal corporation or water utility, or a PSU — 324 segment selections in total across those three categories.
The timing pattern is the finding. 190 of these 324 selections came from visitors who registered during the show, against 134 who pre-registered. Public-sector attendance was substantially a walk-in phenomenon.
That is not a small operational detail. It means the government audience — the one the Day One programme was built for, and the one exhibitors most want introduced to — was largely invisible to the organiser until it arrived. A hosted-delegation programme run through utility and ministry channels, with named invitations issued weeks ahead, would convert that from luck into design.
Data caution. Segment tags are self-declared at registration and were not validated against organisation names. A review of the government-tagged records shows some private companies selecting the government category, most likely indicating an interest in government business rather than employment. The 270 figure should be read as an upper bound on public-sector attendance, not a verified headcount.
Beyond the state, sixteen associations and councils participated, including ASSOCHAM as Lead Industry Partner, Water Quality India Association, Global Water Partnership South Asia, the International Council for Circular Economy, the Water Management & Plumbing Skill Council, the Agro Chem Federation of India, the Rajasthan Chamber of Commerce and Industry, the Southern Gujarat Chamber of Commerce and Industry, the Global Waste Cleaning Network, the New Mexico Water and Wastewater Association and The Norwegian Water Association. Sixteen media and knowledge platforms completed the partner layer, taking the total to 39 institutional, association and media partners.
Participation supported under the Procurement and Marketing Support Scheme of the Ministry of Micro, Small and Medium Enterprises, facilitated by Earth Water Foundation.
The PMS Scheme underwrites part of the cost of exhibiting at recognised trade fairs so that a micro or small enterprise stands on the same floor, in the same hall, in front of the same buyers as a global manufacturer. Support covers stand space, participation fees and inclusion in official show promotion.
The logic behind it is a real market failure, stated accurately in the Show Directory: what MSMEs in India's water equipment supply chain usually lack is not capability but visibility. A small manufacturer with a good product can spend years failing to reach the utilities, EPC firms and industrial buyers who would specify it.
Seventeen enterprises exhibited on that basis, marked as MSME throughout the Exhibitor List so buyers could find them, and listed together in a dedicated Directory section. Enterprise category — micro, small or MSME — is shown where declared in the Udyam registration record.
Why this matters commercially. The visitor data shows 232 distributors and dealers attended, and that segment had the second-highest seniority profile of any group at 52.6%. For a micro-enterprise manufacturer, a channel agreement signed on the floor is worth more than a direct sale, and the audience for that conversation was present in volume.
| Enterprise | Stand | Category |
|---|---|---|
| Akvo Atmospheric Water Systems | B18 | MSME |
| Avanz Global Tek Exim · Uttar Pradesh | A23 | Small |
| Cognecto | C21 | MSME |
| Digital Surveillance INC | C63 | MSME |
| Dynamic Equipments | B2 | MSME |
| Empire Enviro Tech · Gujarat | C37 | Micro |
| HAR Wassertec · New Delhi | B50 | Small |
| Jamshedpur Resources | B46 | MSME |
| Nanokriti | C66 | Micro |
| Nevco Engineers | C58 | MSME |
| Ozone India Technology · Uttar Pradesh | C56 | Micro |
| Sarvo Technologies | B26A | MSME |
| SWA Environmental | B69 | MSME |
| TDC Pharmatech Filtration | C4 | MSME |
| Viondot Smart Services | C29 | Micro |
| Window Techs India | C74 | Micro |
| ZENNER Aquamet India | B38 | Small |
Source: Official Show Directory v11, MSME Participation section.
The startup presence at this edition was heavier on the visitor side than the exhibitor side — which is itself the finding.
252 visitors identified their organisation as a startup — 10.9% of everyone who declared a segment, and the fourth-largest segment overall. Nearly half of them attended at founder or director level, and 138 pre-registered, which is a higher advance-planning rate than the audience average.
DPIIT Startup India supported the show and five DPIIT-recognised startups presented on the Innovation Spotlight Arena stage. The gap between 252 startup visitors and 5 startups on stage is the point worth acting on. The demand-side interest from early-stage water companies was roughly fifty times the supply of platform slots given to them.
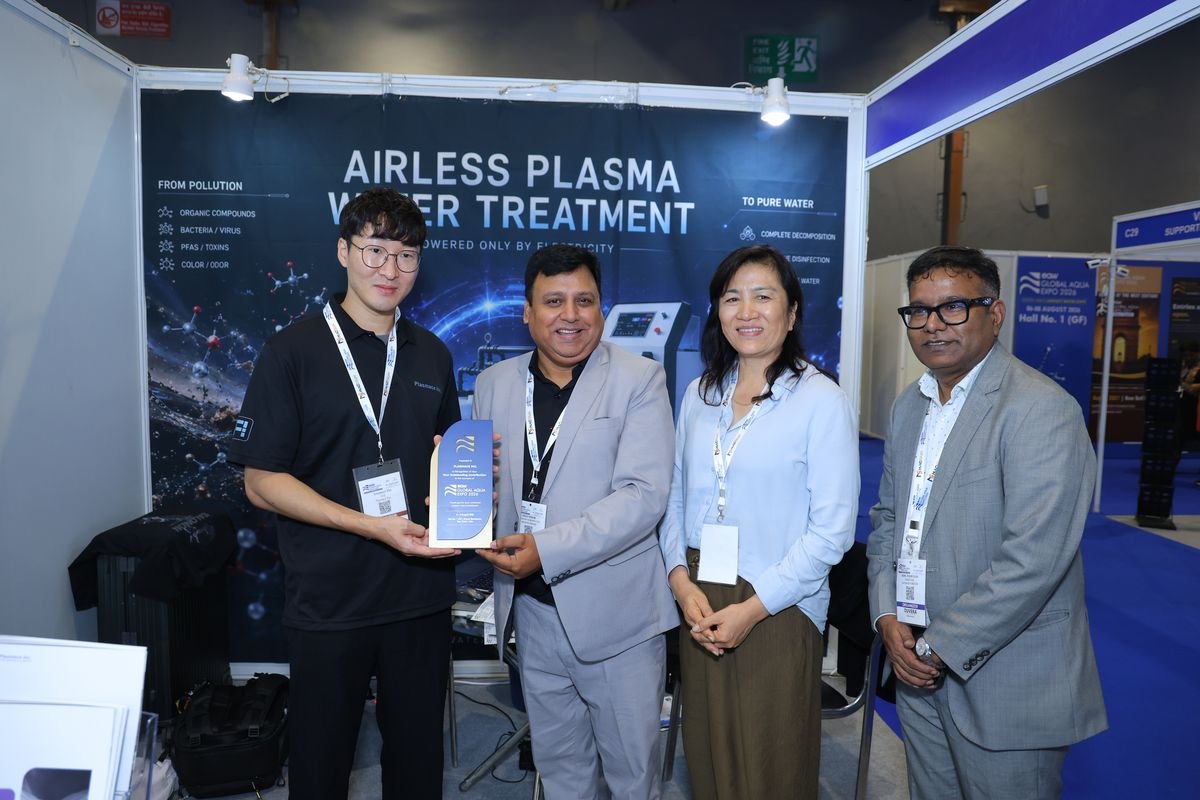
Startup-adjacent technology was nonetheless well represented among exhibitors, if not always labelled as such. Companies on the floor covered nanobubble treatment, atmospheric water generation, robotics for pipeline and sewer inspection, AI-based operations, plasma and electrochemical processes, nanotechnology-based treatment media, and IoT metering and telemetry — technologies that were research topics a decade ago and are now being specified.
| Emerging technology cluster | Listings |
|---|---|
| Digital water, IoT, AI & automation | 19 |
| Instrumentation, metering & sensors | 17 |
| Disinfection, oxidation & advanced processes | 13 |
| Rainwater harvesting & conservation | 7 |
| Environmental monitoring & process control | 5 |
| Industrial automation & telemetry | 4 |
| Atmospheric water & alternative sources | 3 |
| Combined | 68 |
68 of 235 category listings — 28.9% of the floor's declared offer — sat in emerging or digital categories rather than conventional plant, pump, pipe and chemical supply.
The structural read. Nearly three in ten exhibitor listings are in categories that barely existed on an Indian water show floor a decade ago. That is the clearest evidence in this dataset that the market is in a technology transition rather than a replacement cycle.
Eighteen international exhibiting companies from eight countries. Thirty-five international visitors from seventeen countries. Six international speakers. The correct description is an internationally connected national platform, not yet a global exhibition.


A Swiss Pavilion at stands A11–A12 grouped KELLER Pressure, CellX Biosolutions, Huba Control, Swissenviro and Indstrat International Consultants. Hosted international delegations from eight countries were coordinated through the VIP and Delegate Lounge.
| Country | Visitors | Country | Visitors |
|---|---|---|---|
| China | 8 | Germany | 1 |
| Japan | 4 | Sweden | 1 |
| United Arab Emirates | 3 | Poland | 1 |
| South Korea | 3 | Canada | 1 |
| Nepal | 3 | Saudi Arabia | 1 |
| Uzbekistan | 3 | Oman | 1 |
| Nigeria | 1 | Algeria | 1 |
| Kenya | 1 | Côte d'Ivoire | 1 |
| Zimbabwe | 1 |
Organisations represented included Drupps Sweden, Denka Company, Schrader Verfahrenstechnik, PLUM Sp. z o.o., Lycopodium Minerals, Clear Water Solutions (Al Shirawi), Ras Al Hamra, the Austrian Embassy Commercial Section, Henan Wanbang Environmental Technology, Beijing Qinrunze Environmental Protection, and the Environmental Conservation Trust of Zimbabwe.
Taking exhibitors, visitors and speakers together and removing double-counting, 23 countries were represented at the show: India plus 22 others. The exhibitor and visitor country lists overlap in only three cases — China, South Korea and the UAE — which means each channel was reaching a genuinely different geography.
Visitor internationalisation skewed toward Africa, Central Asia and East Asia (Nigeria, Kenya, Zimbabwe, Côte d'Ivoire, Algeria, Uzbekistan, Japan, Nepal). Exhibitor internationalisation skewed toward manufacturing supply from China and Korea and precision instrumentation from Switzerland and Italy. Speaker internationalisation was South Asian and Swiss, built around the rainwater alliance.
35 international visitors out of 5,261 is 1.0%. That is a low ratio for a show carrying "Global" in its name, and this report does not dress it up.
What the data does support is a more interesting and more defensible claim: the platform's internationalisation is outbound rather than inbound. The most substantial international content of the three days was the SEPC World Sustainable Water Summit — a session about getting Indian water companies certified, standards-compliant and export-ready. The commercial opportunity this edition demonstrated is India selling outward, not the world buying inward. That is a sharper and more saleable proposition than a generic global claim, and it should be the positioning for 2027.
The Expo was covered across national broadcast news, business media, trade press, regional Hindi print, international chambers of commerce and independent video creators.
National broadcast and business media carried the inauguration and the close. ETV Bharat framed its coverage around water at the heart of India's Viksit Bharat 2047 agenda. Outlook Business covered the inaugural India Water Mandate 2030 session. Lokmat Times reported the convening of water leaders on opening day. Syndicated business wires carried the opening and closing releases nationally, and trade and specialist media covered the Expo across the water, agriculture, food processing and industrial verticals.
Regional Hindi print carried both the inauguration and the conclusion. International visibility included coverage through bilateral chamber of commerce networks in Europe ahead of the show. Independent video creators attended and published walkthroughs and exhibitor features from the floor.
The campaign included outdoor advertising across Delhi NCR approach routes to Pragati Maidan, alongside on-site branding, exhibitor fascia and dedicated photo points within the hall.
The EAW Water Leaders Studio recorded 52 interviews across the three days with CEOs, policymakers, utility leaders, researchers and international delegates. Unlike a press placement, this is an owned asset with a working life well beyond the show — it continues to carry exhibitor and speaker positioning into the months between editions, and it is the single most reusable piece of content the platform produced this year.
The quotations below were given by exhibitors following the 20th edition in 2025. They are reproduced here, attributed to the edition in which they were given, because 2026 testimonials had not been collected at the time of publication.


This report does not create quotations. Every testimonial below is a real statement given by a named exhibitor about the 2025 edition of this platform.
Five of the companies quoted returned to exhibit in 2026 — VA Tech Wabag, NICO Nanobubble India and IOTA Water, Mediqua, Solinas Integrity and Optex Pinnacle — which is itself the most useful thing these quotations demonstrate. 2026 testimonials will be added to this report as they are received.
It was an honour to participate as Sustainability Partner. The event served as a remarkable platform to exchange ideas, showcase innovations and engage with global leaders in the water sector. Our Head of Sustainability was privileged to deliver a keynote on circularity in water for sustainability. We sincerely thank EAW for organising such a well-curated event.
Returned in 2026 as Water Infrastructure Partner, stand A25, with a panellist on the CEO's Water Leadership Forum.
We are grateful for the opportunity to showcase our water quality monitoring solutions. The event was a valuable platform to connect with industry leaders, explore emerging trends and highlight the importance of continuous, real-time monitoring for safe and sustainable water management.
Returned in 2026 with a stand at B64.
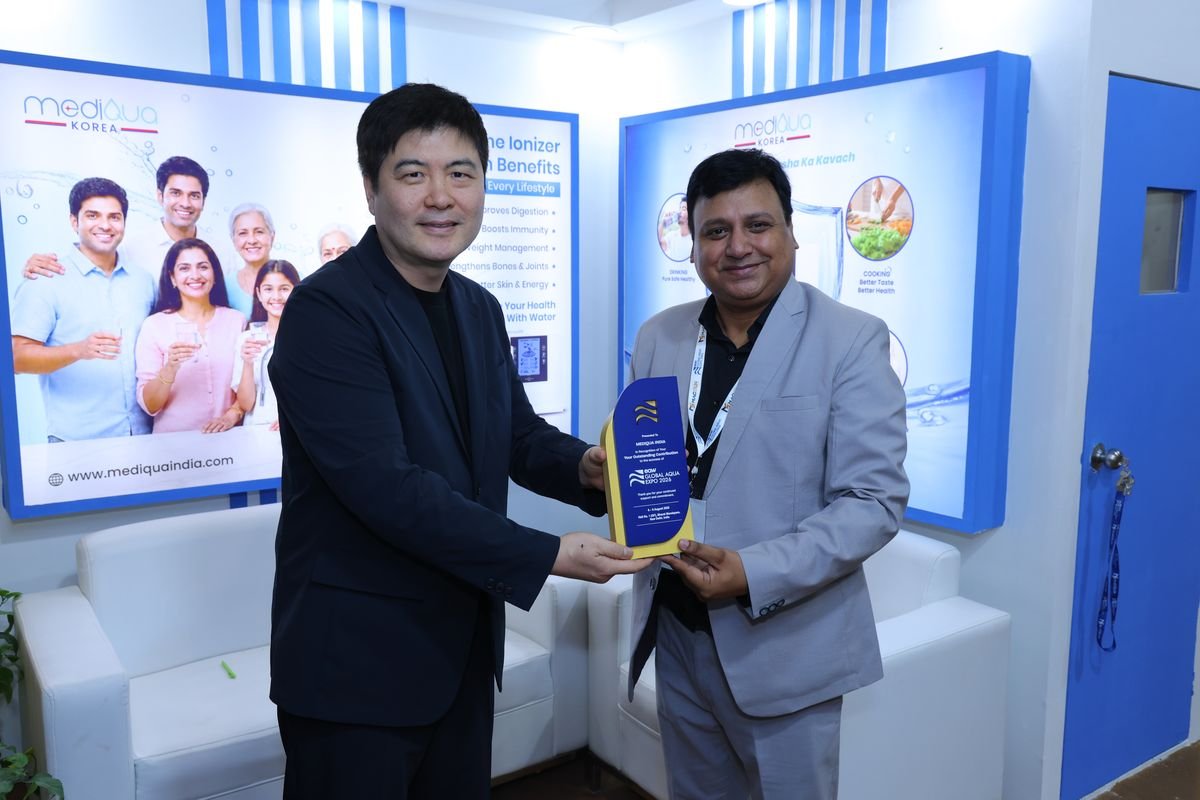
Grateful to be part of the Expo. The event strengthened our Mediqua brand presence across India, expanded our network and inspired new ideas for the future.
Returned in 2026 with stands at B10 and B11.
Participating was a valuable experience for NICO Nanobubble India Co. and IOTA Water. The event was seamlessly organised and provided an excellent platform to showcase our indigenous nanobubble technology while engaging with key stakeholders and industry leaders. We sincerely thank the EAW team.
Returned in 2026 as Platinum Sponsor, stands A5 and A6, with the group Chairman speaking on two conference panels.
Solinas was glad to exhibit, showcasing our water and sanitation solutions while connecting with experts tackling water and wastewater challenges. A valuable experience — we look forward to future editions.
Returned in 2026 with a stand at C28.
One 2025 exhibitor asked for more promotional activities and interactive opportunities to lift visitor engagement at stands, and suggested moving the show earlier in the calendar, ahead of the festive season. The 2026 edition moved from late August to early August, and added the Innovation Spotlight Arena as a free stage available to every exhibitor. Publishing the criticism alongside the praise is deliberate. It is also the reason the 2026 date changed.
So the show was run to the standard it asks the industry to meet. What follows separates what was delivered from what is ongoing practice.
The Show Directory and the conference agenda were published digitally rather than printed at volume, removing the single largest paper item a show of this size produces. Exhibitors were asked to offer digital brochures and to collect leads electronically.
Signage, banners and stand materials were specified toward sustainable and reusable options wherever a supplier alternative existed, and shell scheme structures are modular and carried across editions rather than built and discarded.
Refill points replaced bottled water wherever the venue permitted, and visitors were asked to bring a bottle. Water used in live demonstrations was recirculated by exhibitors. Stand lighting specifications favoured LED, and catering volumes were planned against live registration data to limit surplus.
Exhibitors are asked to design raw-space stands for reuse rather than single-edition builds, and to avoid vinyl where an alternative exists. The organiser works with the venue on hall conditioning during build-up and dismantling, and on surplus food redistribution where the venue supports it. Visitors were asked to recycle badge holders at the exit.
No waste tonnage, energy consumption, carbon footprint or diversion-rate figures were measured for this edition, and none are published here.
A paperless directory and agenda for a show of 164 organisations and 5,261 visitors is a material and verifiable reduction, and it is stated as delivered. Everything beyond it is described as practice rather than as a measured outcome. Measuring waste, energy and catering surplus at the 2027 editions would let this section report results instead of intentions, and would give sponsors with ESG reporting obligations something they can actually use.
Descriptive statistics are in the preceding sections. These are the conclusions the numbers support — including the ones that are uncomfortable.
38.9% of all visitors, and 45.3% of those with a classifiable title, held owner, CXO, director or senior-management roles. More importantly, seniority was highest in the segments that buy: EPC contractors at 53.9%, distributors at 52.6%, manufacturers and startups at 46.4%, water and wastewater companies at 45.9%. It was lowest among students, researchers and government departments. That distribution is exactly the right shape — the people who could sign were the people at the stands.
1,116 of 1,702 respondents selected sourcing, supplier meetings, business and networking, or partnerships. Only 413 came primarily for knowledge. The gap is decisive and it should shape how the platform sells itself: this is a commercial floor with a serious conference attached, not a conference with a trade display.
61.6% of visitors came from Delhi NCR and 83.9% of Indian visitors from the northern states. The five states holding the majority of India's industrial water demand — Maharashtra, Gujarat, Karnataka, Tamil Nadu and Telangana — supplied 355 visitors between them, 10.1% of the total. An exhibitor selling into Southern pharma or Western textiles met a fraction of their addressable market at this edition.
190 of 324 government, municipal, utility and PSU segment selections came from visitors who registered on site. Industrial end users showed the same pattern even more sharply: 164 on-site against 68 pre-registered. The buyers with the most operational authority are the least reachable through advance registration, and any matchmaking process built on pre-show data will systematically miss them.
Measurement and intelligence categories — digital water and AI, instrumentation and metering, environmental monitoring, industrial automation, water quality monitoring — together account for 48 exhibitor listings, level with the entire treatment-plant category. A full conference session was given to Smart Water 4.0, keynoted by Delhi Jal Board. Supply and demand are now aligned in this category in a way they were not five years ago.
Water and wastewater treatment plants at 48 listings is nearly three times the next category, while pumps sit at 6 listings and aeration and sludge handling at 6. Against 232 distributor and dealer visitors actively looking for products to carry, and 89 EPC contractors shortlisting suppliers, the component and rotating-equipment side of this floor was thinner than the demand justified. That is an exhibitor-acquisition opportunity, not a market problem.
68 of 235 category listings sit in digital, sensing, advanced oxidation, rainwater, atmospheric water and automation categories. Nanobubbles, atmospheric water generation, sewer robotics, plasma processes and nanotechnology media were all present as exhibiting businesses, not as research posters. A market in a technology transition looks like this. A mature replacement market does not.
Rainwater harvesting had a full afternoon forum with international speakers and 7 exhibitor listings. Atmospheric water generation took two of seven Day One Arena slots and has 3 listings. Reuse and circularity carried a headline panel and an entire training day but no distinct exhibitor category. In each case the conversation is ahead of the commercial supply — which is where a show can create a market rather than just serve one.
252 visitors identified as startups, 46.4% of them at founder or director level, against 5 DPIIT-recognised startups given Arena stage slots. Startup founders came to this show to find customers and channel, and the platform currently offers them a stand or nothing. A structured early-stage programme — pitch track, investor introductions, a shared pavilion — has a demonstrated audience waiting for it.
35 international visitors is 1.0% of registrations, which does not support a "global exhibition" claim on visitor reach alone. But 18 international exhibiting companies from 8 countries, hosted delegations from 8 countries, and a dedicated SEPC summit on export certification and market access describe something more specific and more valuable: a platform where Indian manufacturers get export-ready and international suppliers access Indian demand. That is the claim the data will actually carry.
Observed data, interpretation and forward opportunity are kept separate below. Only the first column is fact.
| Observed | Interpretation | Forward opportunity |
|---|---|---|
| 48 exhibitor listings in treatment plants; 6 in pumps; 6 in aeration and sludge handling. | Indian water suppliers still predominantly sell built systems rather than components into someone else's build. Component specialisation typically follows EPC consolidation. | Targeted acquisition of rotating equipment, sludge handling and process-component manufacturers. A 232-strong distributor audience is already in the room for them. |
| 48 combined listings across digital water, instrumentation, monitoring and automation. Smart Water 4.0 keynoted by a utility. | Metering, telemetry and analytics have moved from proof-of-concept to specification. Non-revenue water and compliance measurement are now procurement line items. | A dedicated digital water zone with a live data and SCADA demonstration environment. The exhibitor base to fill it already exists on this floor. |
| 232 industrial end users attended; 164 of them registered on site. Textile, leather, chemical and engineering cluster cities appear throughout the top 20. | Industrial water demand is real, local and enforcement-driven, and it is not being reached through advance marketing channels. | Cluster-level outreach through industry associations in Panipat, Ludhiana, Kanpur, Agra, Meerut and Sonipat, with hosted transport and named delegations. |
| Reuse and circularity carried a headline panel, an entire Day Three masterclass on ZLD, but no distinct exhibitor category. | Reuse is being discussed as economics rather than as compliance. The Directory's own position — reuse is the cheapest new source of water an industrial site has — is now a mainstream sector view. | Create reuse, ZLD and resource recovery as a named exhibitor category and a named floor zone. The demand-side language is already there; the supply-side labelling is not. |
| SEPC convened a full summit on standards, certification and export competitiveness with Bureau Veritas, NSF and the TIC Council. | The binding constraint on Indian water exports is being identified as certification and standards conformity, not product capability or price. | A permanent export-readiness clinic across all three days, with certification bodies taking scheduled one-to-one appointments rather than a single panel. |
| Canara Bank on an infrastructure financing panel alongside a state Water Resources Department. | Water infrastructure delivery is being framed as a financing and sustainment problem rather than a design problem. | A financing and project-structuring track aimed at municipal and state utility officers, who currently attend but do not have content built for them. |
| 109 municipal and utility visitors, 42.2% at senior level; Delhi Jal Board the single most represented organisation with 23 registrations. | Utility engagement is real but locally concentrated. One utility dominates because the show sits in its jurisdiction. | A hosted utility programme drawing municipal corporations from at least ten states, funded as a sponsorship product rather than an organiser cost. |
What follows is what the verified visitor data says an exhibitor had access to.
| Audience pool | Total | Per stand |
|---|---|---|
| All registered visitors | 5,261 | 25.8 |
| Broad buyer pool | 1,355 | 9.9 |
| Declared commercial intent | 1,116 | 8.1 |
| Owner / CXO / director / senior | 1,454 | 10.0 |
| Demand side only | 781 | 5.7 |
| Actively sourcing technology | 537 | 3.9 |
| Distributors and dealers | 232 | 1.7 |
| Distinct visitor organisations | ~3,990 | 19.0 |
Calculated across 137 organisations with allocated stands. These are access ratios, not lead counts — no lead-capture data was supplied.
What would make this section stronger next time. A short structured exhibitor survey issued within seven days of close — leads captured, meetings held, orders quoted, satisfaction, rebooking intent — would convert this from an access analysis into a value analysis. It is the single highest-return addition to the post-show data set.
Stated intent from 1,702 visitors, matched against what the programme and floor actually provided.
| Stated reason | Visitors | What the platform provided against it |
|---|---|---|
| Visiting the exhibition | 1,025 | 137 stands across 22 product and solution categories in a single ground-floor hall, open 10:00 to 18:00 on all three days, organised into shell scheme, raw space, an MSME presence, a Swiss Pavilion and a table-display zone. |
| Business & networking | 655 | The Global Water Business Lounge, a working networking lunch scheduled as a session on Day One, tea breaks timed to push the conference audience onto the floor, and the VIP and Delegate Lounge by invitation. |
| Meeting exhibitors & suppliers | 600 | A four-step matchmaking process through the organiser desk: register requirement, receive shortlist, meet in 15–30 minute lounge slots, agree a next step at the table. |
| Sourcing new technologies | 537 | The Innovation Spotlight Arena with twenty-minute live launches and demonstrations across all three days, plus a product-category index in the Show Directory allowing a buyer to walk a category rather than a hall. |
| Attending the conference | 314 | Six convened forums and 13 content sessions across three days, with 55 speakers spanning ministries, utilities, industry leadership, standards bodies, academia and six international organisations. |
| Technical training | 245 | A full-day EAW Water Academy masterclass on ETP, STP and ZLD design calculation and troubleshooting, with a certificate of participation. |
| Partnership opportunities | 195 | Hosted international delegations from eight countries, the SEPC export desk, the Government and Facilitation Hub, and 18 international exhibiting companies on the floor. |
No visitor, exhibitor or speaker quotations were supplied in the source material for this report. Exhibitor quotations from the 2025 edition are reproduced in this section and labelled as 2025. On-floor testimonial capture is being introduced at both 2027 editions.
38.9% senior-level participation, 65.6% declared commercial intent among respondents, and a buyer pool of 1,454 across ~3,990 organisations are strong, evidence-backed numbers that will stand up to an international exhibitor's scrutiny. The 5,000+ figure will not, on the data supplied. Lead with quality.
Bharat Mandapam gives access to the densest concentration of water policy and institutional decision-making in India, and the Day One programme monetised that properly. It does not give access to the industrial water demand that sits in the South and West. Both facts are true and the 2027 two-city calendar is the correct response to them.
48.7% of registrations happened on site, and the on-site cohort was disproportionately industrial and public-sector — the exact groups exhibitors most want matched. Fixing this is a pre-show acquisition problem, not a floor problem.
34.2% of visitors made no industry-segment selection and 51.8% skipped the purpose question entirely. Those two fields are the entire basis of buyer matchmaking, exhibitor reporting and this report's segmentation. Making them required, with a short forced-choice list, would raise the analytical value of the next edition's dataset dramatically at zero cost.
The visitor database is clean, deduplicated and well-structured — genuinely good work. The B2B meeting log, Arena delivered programme, Studio interview record, training enrolment and exhibitor feedback do not exist at the same standard, Closing that gap is the difference between a good post-show report and an unarguable one.
Every one of these five is fixable before the Hyderabad edition in January 2027. None requires additional budget. All five require deciding, now, what will be counted.
From 2027 the platform runs twice a year: Hyderabad at HITEX in February, where the plants are, and New Delhi at Bharat Mandapam in August, where the policy is. Each recommendation below is tied to a finding in this report.

Evidence 355 visitors from Maharashtra, Gujarat, Karnataka, Tamil Nadu and Telangana — 10.1% of the total. Pharma effluent treatment led the Day One Arena programme.
The Southern edition's audience acquisition should be built on pharma and bulk drug, data centres, textiles and food processing, sourced through state industry associations and pollution control boards rather than national channels.
Evidence 190 of 324 public-sector selections and 164 of 232 industrial end users registered on site rather than in advance.
The most valuable audience currently arrives by accident. Named invitations issued through ministry, utility and association channels six weeks ahead, with travel support for a defined delegation, converts that into a sponsorable, reportable programme.
Evidence 242 meetings against 1,116 declared commercial visitors — a 21.7% conversion.
The measurement discipline introduced this year worked. More tables, more matching staff and a pre-show requirement capture form would lift the conversion; recording buyer organisation and agreed next step against each meeting would let the platform report outcomes, not just volume.
Evidence 34.2% no segment declared; 51.8% no purpose declared; an unlabelled field with 384 responses that could not be interpreted at all.
Make industry segment and purpose mandatory single-or-multi select with no free-text escape. Add procurement role, project stage and technology interest. Label every field. This is the cheapest quality improvement available to the platform.
Evidence 245 declared training intent; more than 50 certified; roughly 195 unmet.
Split into a municipal-utility track and an industrial track, or run the ETP/STP/ZLD masterclass twice. Certification records become a knowledge-value metric the platform can report and monetise.
Evidence 252 startup visitors, 46.4% at founder or director level, against 5 DPIIT startups on the Arena stage.
A shared innovation pavilion at subsidised rates, a dedicated pitch track with investor and incubator attendance, and scheduled introductions to utility and industrial buyers. DPIIT Startup India already supports the platform; the format is the missing piece.
Evidence 6 pump listings and 6 aeration and sludge listings against 232 distributor visitors and 89 EPC contractors.
Pumps, valves, blowers, sludge handling and dosing are under-represented relative to the buying audience present. This is direct, quantified sales collateral for the exhibitor acquisition team.
Evidence A headline circular-economy panel and a full ZLD training day, but no distinct exhibitor category for reuse or resource recovery.
The demand-side language exists. The supply-side labelling does not, which makes reuse suppliers hard for a buyer to find on the floor.
Evidence The SEPC World Sustainable Water Summit identified certification and standards conformity as the binding constraint on Indian water exports, with Bureau Veritas, NSF and the TIC Council present.
Scheduled one-to-one certification appointments across all three days would serve a defined commercial need and give SEPC a measurable outcome from its participation.
Evidence 2026 is the first edition whose headline figures can be reconstructed from a named list, a registration database or an operational record.
Apply the identical definition at Hyderabad in February and New Delhi in August: unique badge records for visitors, itemised lists for exhibitors and speakers, logged meetings, launches, interviews and certifications. Three editions counted the same way produce a trend line the market will trust. One inflated figure anywhere in the series destroys all three.
Evidence 1.0% international visitor share against 18 international exhibiting companies, 8 hosted delegations and a dedicated export summit.
"Where Indian water technology meets the world's buyers, and gets export-ready" is defensible on this data. A generic global-exhibition claim is not, and an international exhibitor will check.
A report of this kind is only as credible as its worst-sourced figure. This section states what was verified and what was calculated.
Four tiers were applied in this order. Verified data — direct counts from the final visitor database. Source documents — the Official Show Directory v11 and the final speaker list. Calculated insights — figures derived arithmetically from the above, identified as such. Editorial interpretation — analysis, clearly separated from fact, concentrated in Sections 27, 28 and 32.
| Data | Source file | Treatment |
|---|---|---|
| Visitor totals, geography, segments, designations, intent, registration timing | Final_Visitors_Data_Expo_2026_FINAL_WITH_INDUSTRY_SEGMENTS.xlsx, sheet "Visitor Data" | 5,456 rows analysed in full, deduplicated to 5,261. No sampling. |
| Exhibitor list, stand allocation, product categories, MSME participation, partner list, B2B and Arena descriptions, conference agenda | EAW_Global_Aqua_Expo_2026_Show_Directory_v11.docx | Structured extraction of all tables and category indices. |
| Speaker count and affiliations | Speakers.docx (final list) | 55 entries, classified by organisation type. |
| Session detail, panellists, Arena Day One programme, floor zones | EAW_Global_Aqua_Expo_2026_Event_Guide.md | Used for programme detail only. |
| B2B meetings held, Arena launches delivered, Studio interviews recorded, training certifications, exhibition and total area | Organiser operational records for the delivered event | Used as delivered figures. |
| Media placements and press coverage | Organiser media monitoring record and press clipping file | Count of placements only. No reach or AVE calculated. |
| 2025 comparison figures and exhibitor testimonials | Post Show Report, 20th EverythingAboutWater Expo 2025 | Used for edition comparison and for labelled 2025 quotations. |
The following are arithmetic derivations, not source figures: the 23-country total (union of exhibitor, visitor and speaker country lists with overlaps removed); the demand-side, supply-side and broad buyer pool counts (unique visitors selecting any segment in each defined group); the Delhi NCR total; the regional zone distribution; all seniority bands and shares; the commercial-intent and knowledge-intent totals; per-stand access ratios in Section 29; the 3,992 normalised organisation count (4,788 named organisations reduced by removing legal-form suffixes and case and punctuation variance); the 21.7% meeting conversion; the 1.77 meetings per stand; the 40% named-exhibitor retention rate; and the square-metre ratios in the exhibitor section.
Complete list from the Official Show Directory v11. MSME marks enterprises exhibiting with support under the Procurement and Marketing Support Scheme of the Ministry of MSME.
Source: EAW Global Aqua Expo 2026 Official Show Directory v11, Exhibitor List and Participant Directory. Stand numbers were correct at time of printing.
Hyderabad in February reaches the South and West that this edition did not. Delhi in August defends twenty-two years of habit. Space is being allocated now.
Book stand space Register free to visit